



The principle of protein interaction network analysis is that a graph is drawn from a written edge rule. A node is a protein name. An edge is a statement the analyst already chose: co-enrichment with a bait, a yeast two-hybrid reporter, a public database link, or another labeled source. The drawing does not decipher the interactions among proteins in a biological system, and it does not unravel disease mechanisms or drug targets.
Proteins still execute cellular processes, and those processes remain contexts in which a graph may be inspected. They are not outputs of the layout. Systems biology is a field label. It is not granted by placing names on a canvas. For the AP-MS table that is often drawn this way, Affinity Purification Mass Spectrometry and Network Analysis to Understand Protein-Protein Interactions provides a complementary drawing page.
Researchers who already have a ranked table and need a method match before any graph is styled can also review the MtoZ Biolabs Protein-Protein Interaction Analysis Service for project-specific feasibility and analysis planning.
What an Edge Is Allowed to Be
The original direct-versus-indirect split is a later biological claim, not a construction principle. Direct covalent or non-covalent binding is not read from a node pair. Indirect regulation or signal transmission is not the leftover class after a line is drawn. An AP-MS edge is wash-stable co-enrichment. A Y2H edge is reporter reconstitution in yeast. A database edge is a curated or computed literature link. Mixing those sources into one multi-omics network does not convert them into one interaction type.
Construction still uses experimental tables. Mass spectrometry, yeast two-hybrid, and AP-MS can each supply names. Analyzing those data creates a diagram only after an edge rule is written. Key nodes and modules are then properties of that diagram. They are not discovered regulators. For what an AP-MS name is allowed to support before it becomes a node, Understanding AP-MS: A Comprehensive Guide provides a complementary evidence page.
Public databases can overlay additional edges. Overlay is a label. It is not independent proof. For how those repositories are read, What Are the Protein-Protein Interaction Databases? provides a complementary database page.
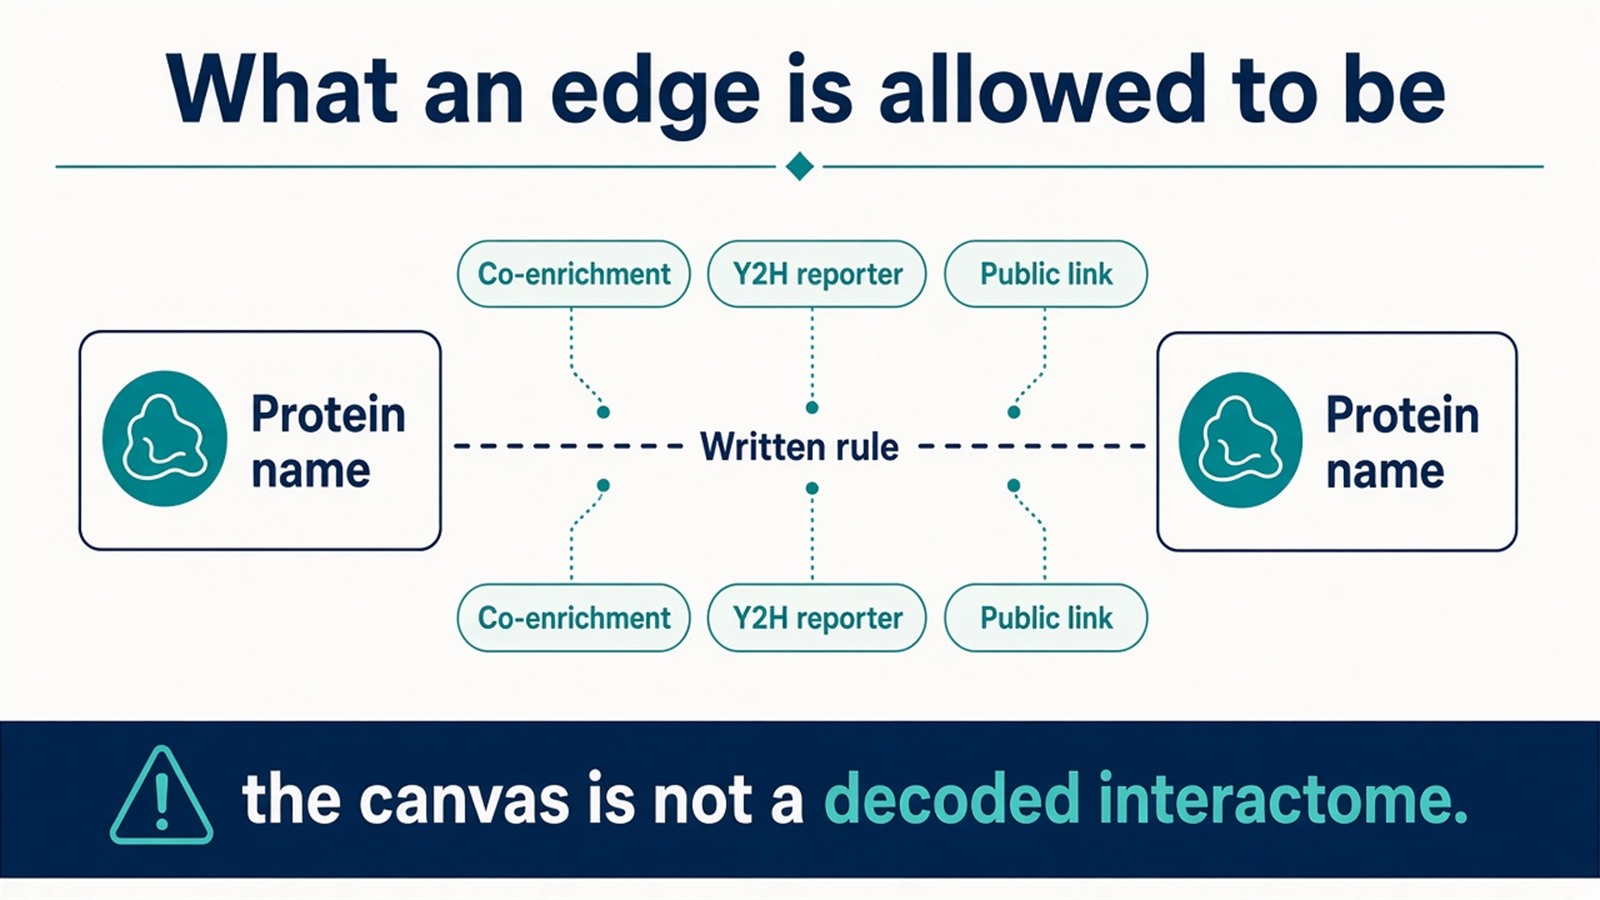
Figure 1. Nodes are accessions. Edges follow a stated rule: co-enrichment, a Y2H reporter, or a labeled public link. The canvas is not a decoded interactome.
Write the edge rule before the first layout. Do not write the layout as direct or indirect biology.
Topology Is a Property of the Drawing
Some published protein-interaction graphs have short paths and a heavy-tailed degree distribution. Those are graph statistics. They are not a law that protein interaction networks exhibit small-world and scale-free properties in the cell.
The original small-world sentence overreaches. A short path in the drawing does not facilitate rapid information transfer in a cell. Scale-free language, when it is used, means a few nodes have many edges under the written rule. A hub can be a scaffold. It can also be a sticky contaminant, a highly studied protein, or an artifact of merging databases. Hub status does not make a protein a key regulator, and it is not essential for relating that protein to disease.
Degree, betweenness, and other centrality scores rank the drawing. They do not highlight biological importance. A high-centrality name is a name with many written edges. For the interaction sentence behind an AP-MS edge, AP-MS Protein Interaction provides a complementary claim page.
Methods, Recast
Modular analysis finds densely connected groups in the current graph. That density is not a biological function module. Pathway analysis overlays a pathway term on a subset of nodes. It does not identify a signaling pathway, and it is not particularly useful in disease research by being named pathway analysis. Key-node identification calculates centrality. It does not assign cellular roles.
These methods can make a long table inspectable. They assist review. They do not assist researchers in understanding the specific roles of proteins in cellular processes unless a separately validated assay is already named.
Cancer, neurological, and cardiovascular settings remain allowable as study backgrounds. A module that is enriched for a disease term is a labeled subset. It is not a protein module closely associated with cancer, and it does not provide a potential anticancer target, a basis for drug repurposing, or a multi-target therapy strategy. A global or systematic perspective is a viewing choice. It is not a measurement advantage over a single-protein experiment.
The original challenge list is true and incomplete. Experimental tables carry noise. That noise is why an edge rule and a control arm have to be written first. Dynamic cellular environments are not captured by a static drawing. Integrating more data sources and more precise models does not, by itself, enhance reliability. It can propagate the same unlabeled edges farther.
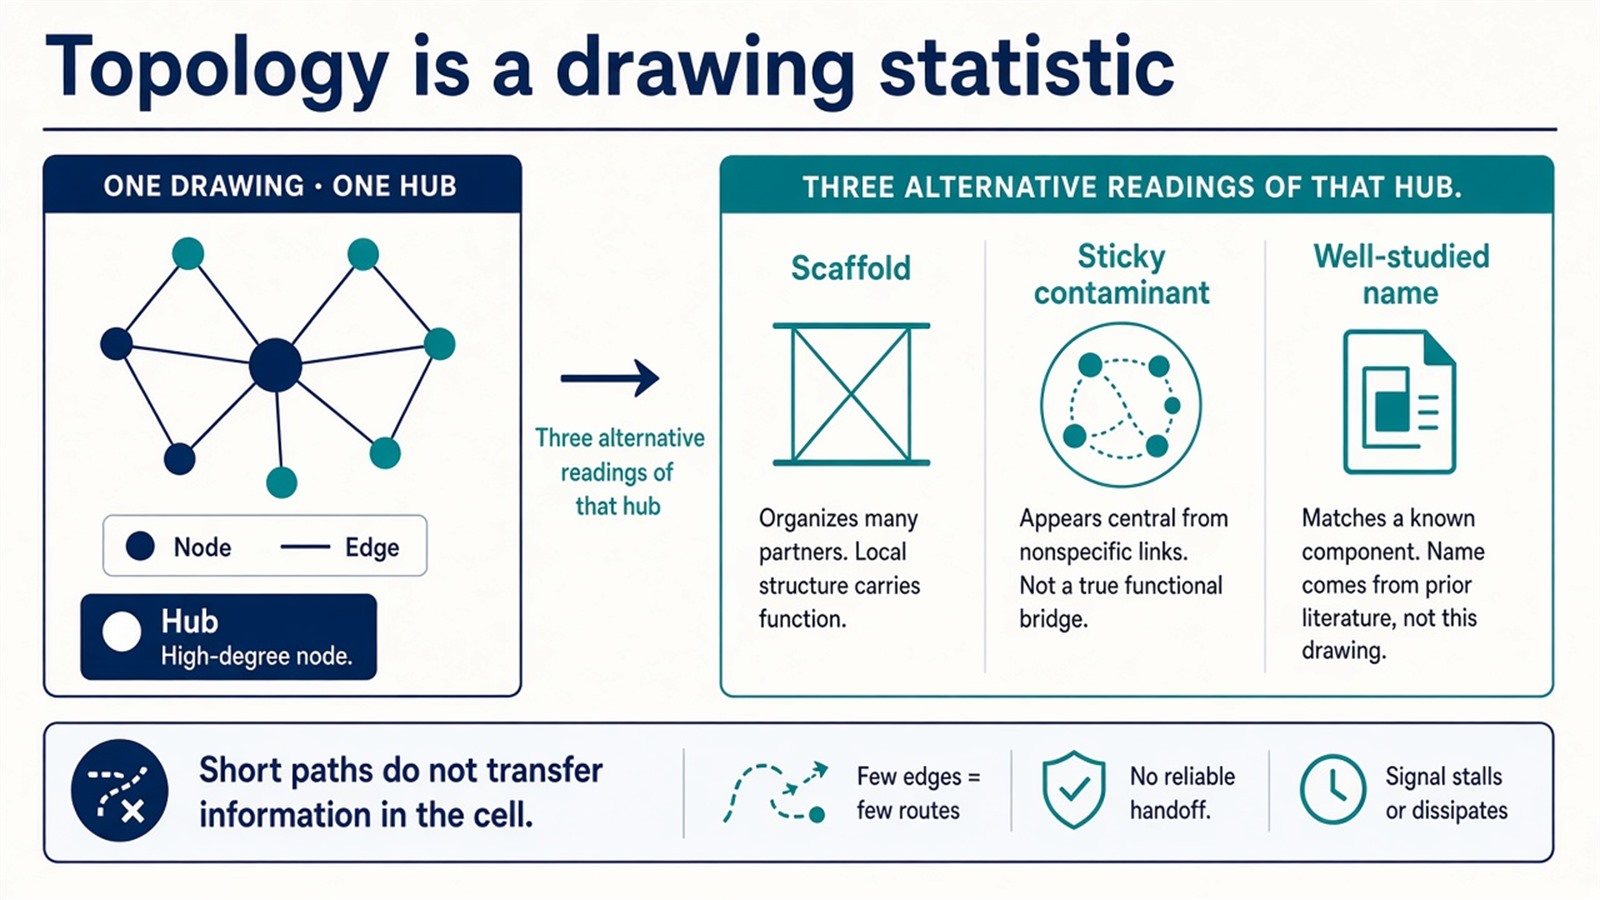
Figure 2. Short paths and high-degree nodes are drawing statistics. A hub can be a contaminant. A dense module is not a function block.
Experimental Limits
Network analysis, on this principle, reduces a project to one edge rule, one graph, and one claim level. Disease-mechanism, drug-target, information-transfer, and systems-biology-decoder language sits outside ordinary research reporting unless a separately validated assay is already named. A cleaner layout does not make the network accurate.
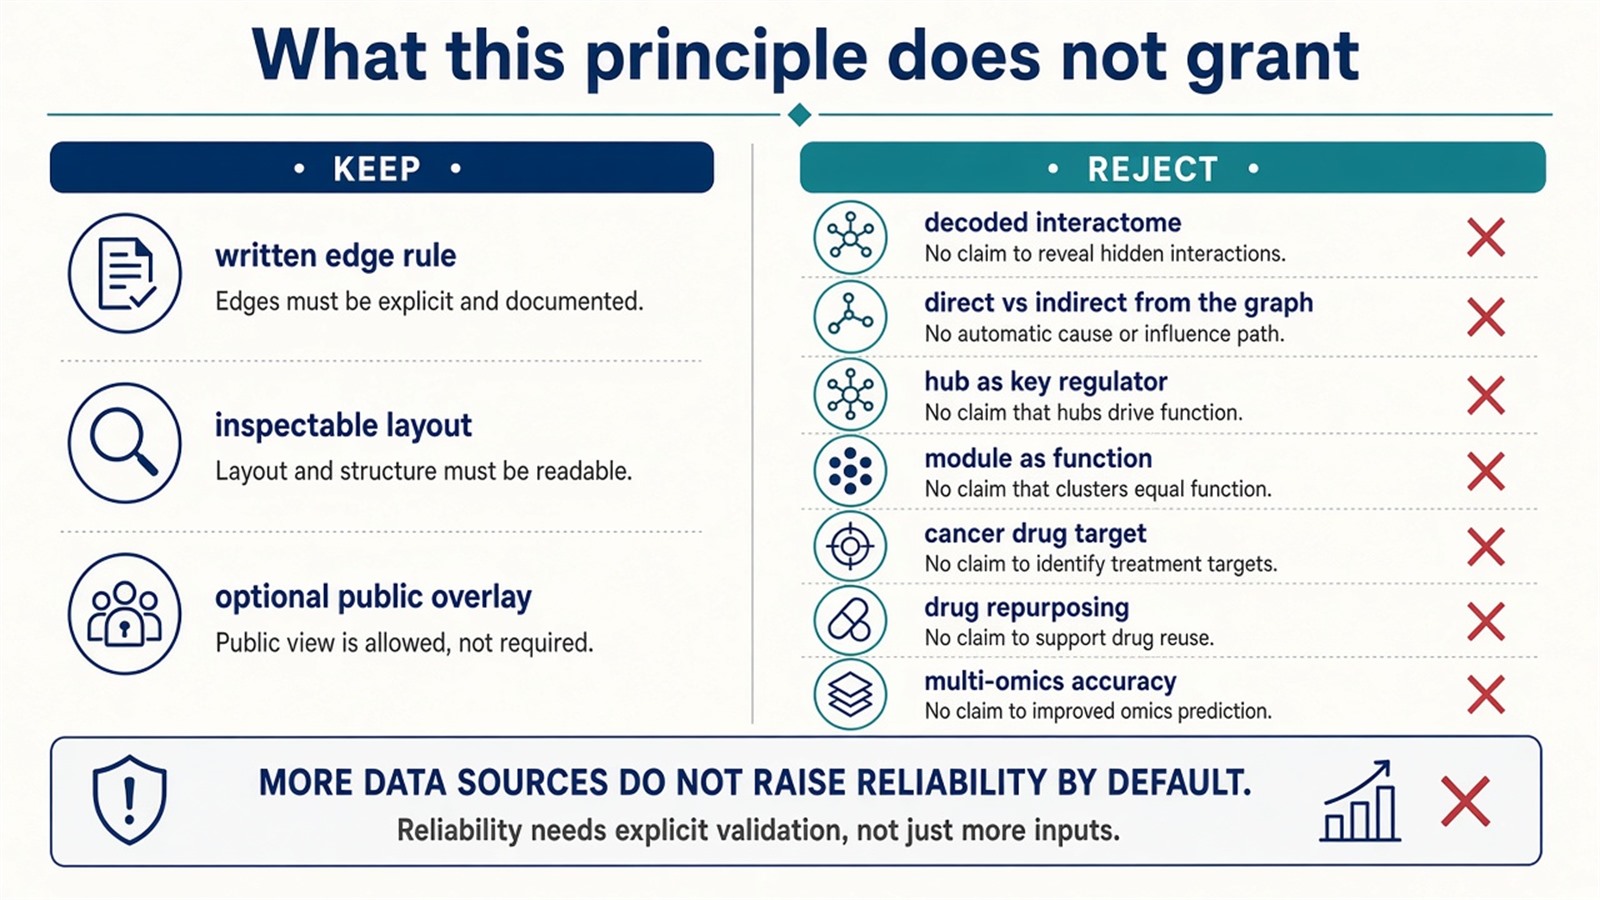
Figure 3. Keep: a written edge rule and inspectable layout. Not granted: decoded interactomes, hub regulators, cancer modules as targets, or multi-omics accuracy.
Project Planning and Service Scope
A usable request names the edge rule, the experimental table that will supply nodes, and the sentence that will be allowed after the layout. If the table is a tagged-bait co-enrichment file, the project is usually scoped as AP-MS before any graph is drawn. MtoZ Biolabs scopes that file on Orbitrap-class LC-MS/MS. Interpretability still follows the table, not a network-analysis heading.
Once the next sentence is a ranked co-enrichment table rather than a styled graph, this principle page should hand off. Researchers who need that table can review the MtoZ Biolabs Affinity Purification-Mass Spectrometry Service for project-specific sample evaluation, feasibility assessment, and workflow planning.
Frequently Asked Questions
1. Does network analysis decipher protein interactions in a cell?
No. It draws a graph from a written edge rule. The cell is not the canvas.
2. Are direct and indirect interactions read from the network?
No. Those are later biological claims. An edge is only as specific as the rule that created it.
3. Do hubs transfer information rapidly and regulate disease?
No. A hub is a high-degree node in the drawing. It can be a contaminant or a well-studied name.
4. Does modular analysis reveal functional modules?
It finds dense groups in the current graph. Function is a later overlay.
5. Can network analysis provide anticancer drug targets?
No. A disease-term enrichment on a module is a label. A target sentence needs a separately validated assay.
Reference
- Barabási A.L., Oltvai Z.N. (2004). Network biology: understanding the cell's functional organization. Nat. Rev. Genet., 5, 101-113. https://doi.org/10.1038/nrg1272
- Jeong H., Mason S.P., Barabási A.L., Oltvai Z.N. (2001). Lethality and centrality in protein networks. Nature, 411, 41-42. https://doi.org/10.1038/35075138
- Vidal M., Cusick M.E., Barabási A.L. (2011). Interactome networks and human disease. Cell, 144, 986-998. https://doi.org/10.1016/j.cell.2011.02.016
- Gingras A.C., Gstaiger M., Raught B., Aebersold R. (2007). Analysis of protein complexes using mass spectrometry. Nat. Rev. Mol. Cell Biol., 8, 645-654. https://doi.org/10.1038/nrm2208
- Mellacheruvu D., Wright Z., Couzens A.L., et al. (2013). The CRAPome: a contaminant repository for affinity purification-mass spectrometry data. Nat. Methods, 10, 730-736. https://doi.org/10.1038/nmeth.2557
