



The parameters to look for in GST pull-down mass spectrometry (MS) start with bait recovery and enrichment versus a GST-only arm. Spectrum match score, peptide coverage, peptide-spectrum matches (PSM), and false discovery rate (FDR) are identification quality-control fields. They say whether a protein name is supported in that digest. They do not say whether the protein bound the fused cargo. Reading those four scores as the credibility of a protein–protein interaction is how a GST pull-down file is over-interpreted, and it is why a visitor who came for parameters leaves with a generic proteomics glossary.
A glutathione S-transferase (GST) fusion occupies glutathione (GSH) beads. The cargo is the bait. Proteins that remain after a written wash are named by liquid chromatography–tandem MS (LC-MS/MS). A GST-only digest, matched for host and occupancy, is itself a parameter set: if it was not acquired, later scores cannot reconstruct handle background. For the five coupling steps that produce this file, GST Pull-Down Assay Combined with Mass Spectrometry for Protein-Protein Interaction Analysis provides a complementary GST–MS page.
Researchers who already have a GST-bait table, a GST-only table, or a scoring question can also review the MtoZ Biolabs GST Pull Down Assay Service for project-specific feasibility and analysis planning.
Read These Fields First
Before opening score or coverage columns, ask two GST-specific questions.
Was the intended fusion recovered? Unique peptides and intensity should cover both the GST domain and the cargo. High coverage of GST with almost no cargo peptides is a stub, not a successful bait.
Is each candidate enriched against GST-only? Label-free intensity or a paired ratio is the comparison. Subtracting every GST-only identification deletes real partners that leak into the handle arm. For the four analysis questions around that comparison, Analysis of Protein-Protein Interactions Using GST Pull-Down Assay provides a complementary GST analysis path. For the same filter order on an antibody pellet, How to Analyze IP Mass Spectrometry Results provides a complementary IP-MS reading order.
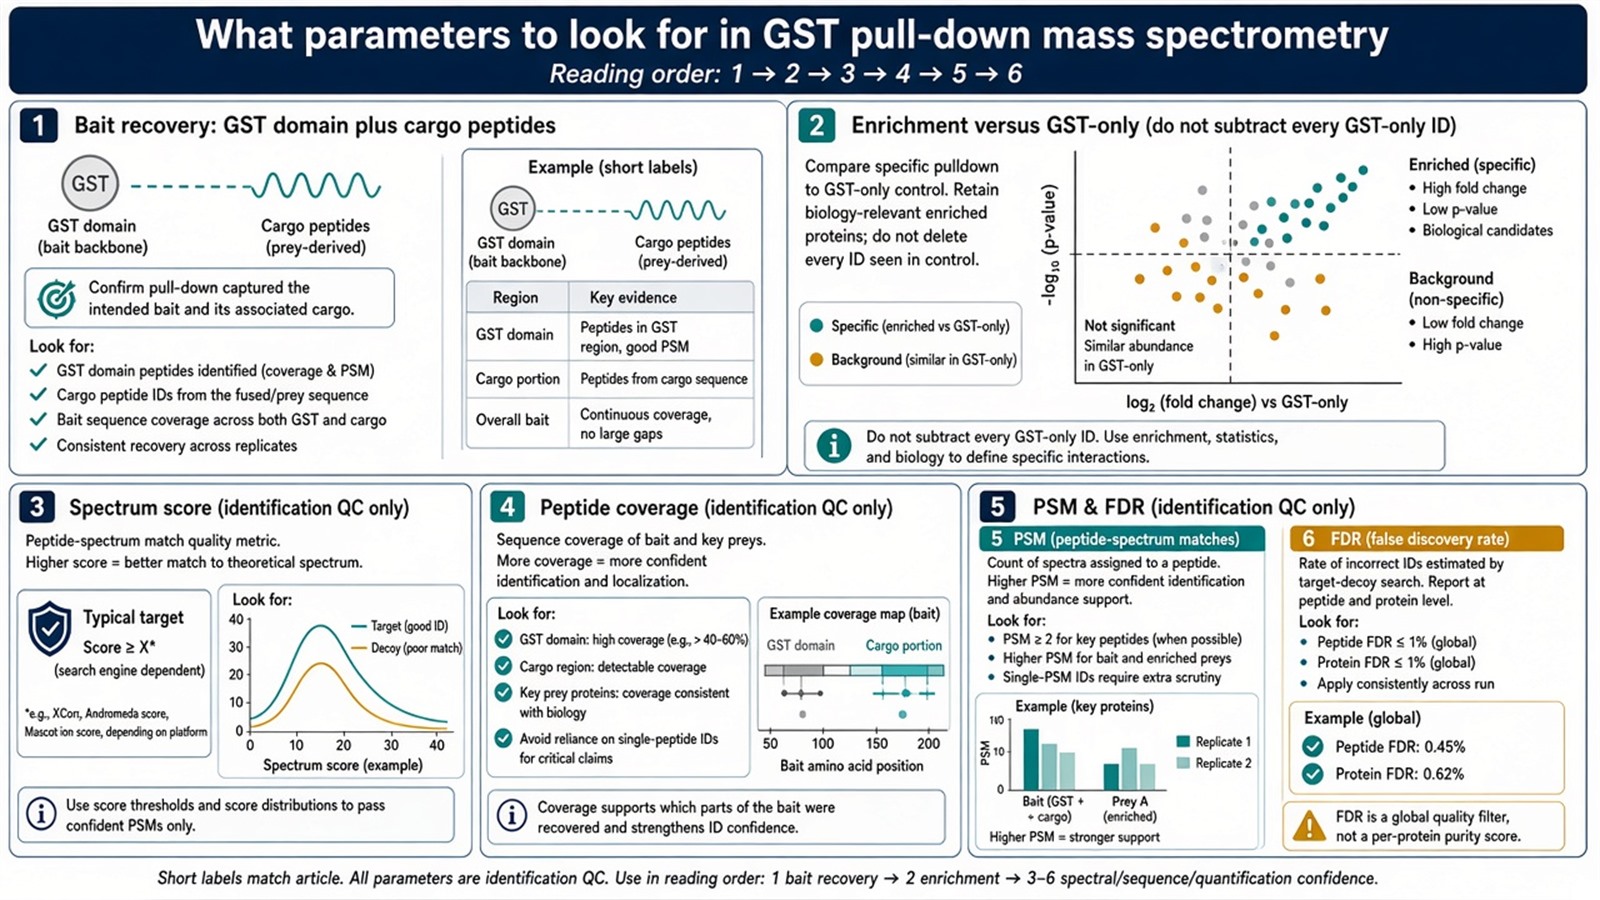
Figure 1. First: bait peptides and GST-only enrichment. Then: score, coverage, PSM, and FDR. The second group cannot replace the first.
Write whether GST-only was run before ranking a prey by score. A high match score on a handle binder is still a handle binder.
Spectrum Match Score
A spectrum match score reports how well a peptide-spectrum match, or a protein group built from those matches, fits the search database. A higher score supports that identification. It does not support that the protein occupied the cargo.
The live-page wording that the score matches “the target protein molecule” to “the protein mass spectrum” collapses peptide evidence into a protein-level slogan. Look at the peptide scores that make up the protein group. One high-scoring peptide is weaker than several independent peptides. Score thresholds are search-engine specific. They are not a GST-only test.
Peptide Coverage
Peptide coverage is the fraction of the protein sequence represented by identified peptides. It describes how much of that sequence was seen. It does not measure comprehensiveness of an interaction screen or accuracy of a PPI call.
For the GST-bait row, coverage that stops inside the GST domain is a fusion-quality parameter. For a prey row, modest coverage is common for a low-occupancy partner. High coverage of a known GST-binding or resin-binding protein is a background flag, not a more complete identification of a partner.
PSM (Peptide Spectrum Matches)
PSM counts how many spectra were matched to peptides of that protein. A high PSM can support identification confidence when the peptides are distinct. It is not a measure of protein abundance in the pull-down, and it is not occupancy of the cargo.
In a complex digest, abundant handle binders collect many PSMs. A scarce true partner can have few. Intensity or label-free quantification (LFQ) on matched bait and GST-only runs is the occupancy field. PSM is a counting field. Treating PSM as abundance is how a GST-binding contaminant outranks a real prey.
False Discovery Rate (FDR)
FDR is a dataset-level error control, commonly reported at 1% for peptides or protein groups. A lower reported FDR means a stricter identification filter on that search. It does not mean the protein list is a more accurate interaction list.
Tightening FDR can delete low-abundance candidates that were still enriched versus GST-only. Loosening FDR admits more names, including more handle binders. FDR does not replace the GST-only arm. For how to read a pull-down table after these fields exist, How to Interpret the Results of a Pull-Down Experiment provides a complementary interpretation order.
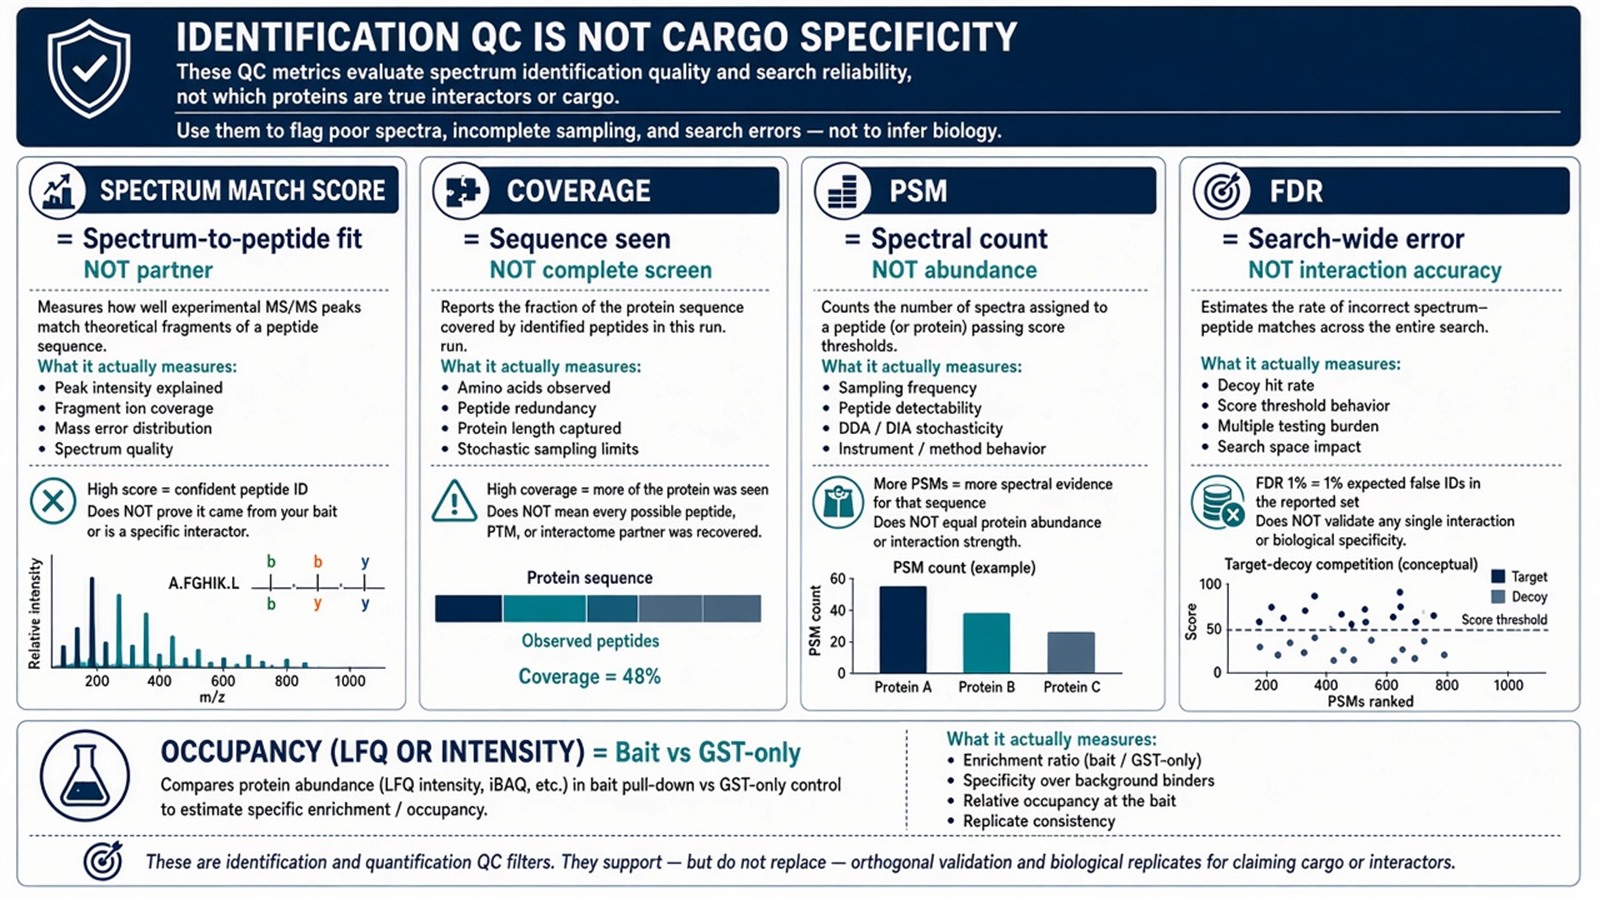
Figure 2. Score fits the spectrum. Coverage is sequence seen. PSM is spectral count. FDR is search-wide error. None of the four is enrichment versus GST-only.
How These Four Parameters Are Misread
The original page treats the four fields as jointly determining accuracy and credibility of GST pull-down MS. They jointly determine whether a name is supported. Credibility of a partner still requires the GST-only comparison.
A high score with no enrichment is a confident handle binder. High coverage of GST alone is a stub bait. High PSM on a CRAPome-class contaminant is expected. A 1% FDR table without GST-only is a clean identification list of an uninterpreted mixture. For how a name is produced before these columns are ranked, Mechanism of Pull-Down Coupled with MS for Protein Identification provides a complementary identification mechanism.
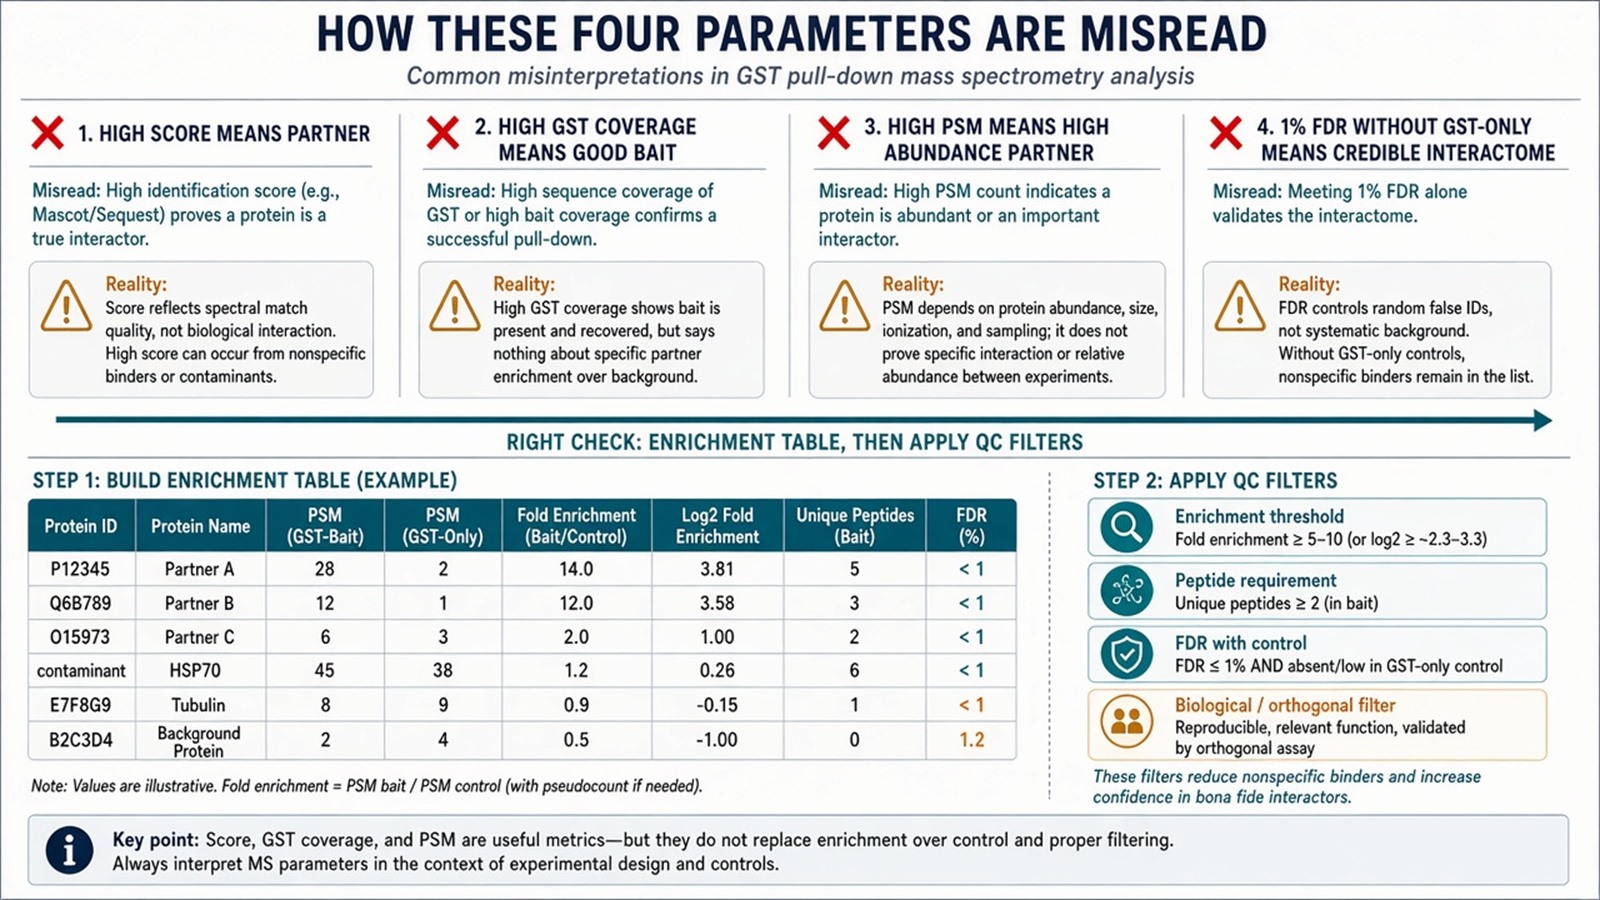
Figure 3. Supported when GST-only exists: an identification-QC filter on an enrichment table. Not granted by any single score: a credible partner, an abundance value, or a complete interactome.
Experimental Limits
These parameters reduce a digest to what the search engine and the two bead arms can report. Diagnostic language sits outside ordinary research reporting unless a separately validated assay framework is in place.
Project Planning and Service Scope
A usable parameter plan names bait-recovery fields, the GST-only enrichment field, and the identification-QC thresholds, before the first search. MtoZ Biolabs scopes GST pull-down with Western or Orbitrap-class LC-MS/MS. Interpretability still follows that order, not the software brand.
Once the table is an open list that needs identification and enrichment, the project can be scoped as pull-down MS. Researchers who need naming and scoring of a GST eluate can review the MtoZ Biolabs Pull Down based Protein Analysis Service with Mass Spectrometry for project-specific sample evaluation, feasibility assessment, and workflow planning.
Frequently Asked Questions
1. What parameters should be looked at first in GST pull-down MS?
Bait recovery (GST plus cargo peptides) and enrichment versus GST-only. Score, coverage, PSM, and FDR come after that comparison.
2. Does a high spectrum match score mean the protein is a partner?
No. It means the identification is better supported. Specificity is the GST-only enrichment.
3. Can PSM be used as abundance?
PSM is a spectral count. Occupancy is better read from intensity or LFQ on matched arms.
4. Does lower FDR make the interaction result more accurate?
It tightens identification error on the search. It does not convert names into partners.
5. How does this page differ from the GST analysis and IP-MS analysis pages?
This page names the columns in a GST pull-down MS export. The GST analysis page orders four experimental questions. The IP-MS page is the antibody-pellet filter order.
Reference
- Cox J., Mann M. (2008). MaxQuant enables high peptide identification rates, individualized p.p.b.-range mass accuracies and proteome-wide protein quantification. Nat. Biotechnol., 26, 1367-1372. https://doi.org/10.1038/nbt.1511
- Mellacheruvu D., Wright Z., Couzens A.L., et al. (2013). The CRAPome: a contaminant repository for affinity purification-mass spectrometry data. Nat. Methods, 10, 730-736. https://doi.org/10.1038/nmeth.2557
- Gingras A.C., Gstaiger M., Raught B., Aebersold R. (2007). Analysis of protein complexes using mass spectrometry. Nat. Rev. Mol. Cell Biol., 8, 645-654. https://doi.org/10.1038/nrm2208
- Dunham W.H., Mullin M., Gingras A.C. (2012). Affinity-purification coupled to mass spectrometry: basic principles and strategies. Proteomics, 12, 1576-1590. https://doi.org/10.1002/pmic.201100523
- Nesvizhskii A.I., Aebersold R. (2005). Interpretation of shotgun proteomic data: the protein inference problem. Mol. Cell. Proteomics, 4, 1419-1440. https://doi.org/10.1074/mcp.R500012-MCP200
