



Fecal Proteomics Data Analysis and Interpretation
Fecal proteomics datasets often show uneven quantitative coverage across samples. A protein may be identified but lack sufficient quantitative evidence for a group comparison; a statistically supported difference may also have limited functional context. The central task is to distinguish detection, quantification, differential evidence, and biological association before assigning meaning to a result.
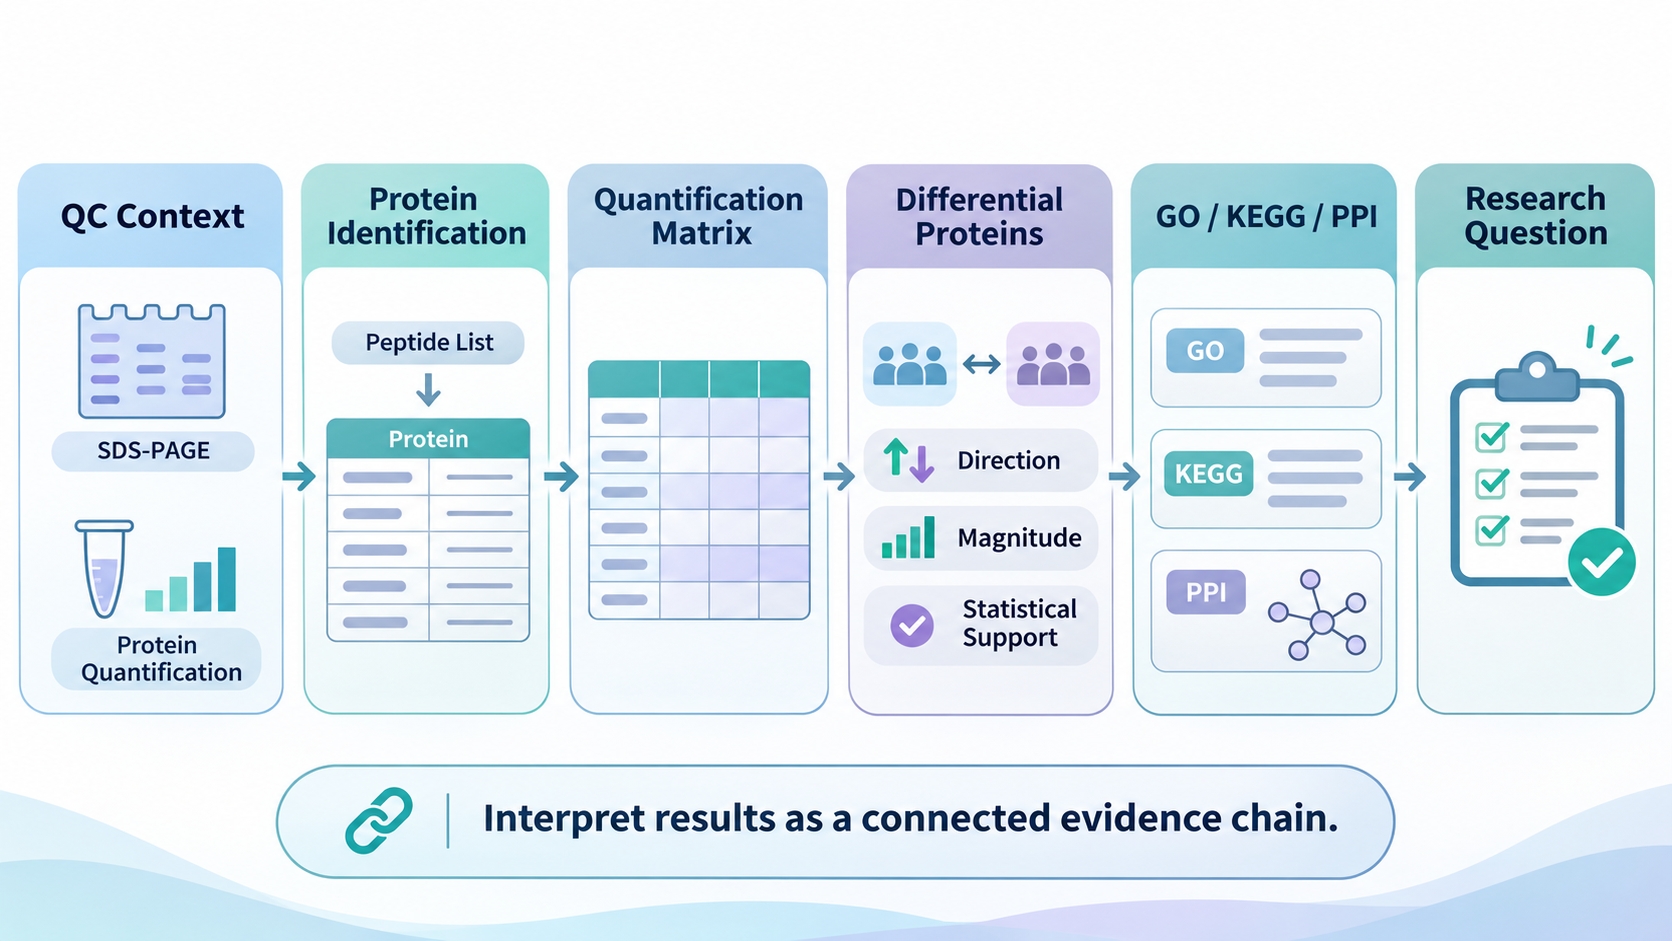
Figure 1. Recommended sequence for interpreting fecal proteomics results.
Sample and Data Quality
Quality control (QC) characterizes the recovered protein material entering LC-MS/MS analysis. SDS-PAGE shows the overall protein band pattern, while protein quantification records the amount of recovered material. Together, the two outputs describe sample-level protein quality and input quantity, providing context for the downstream identification and quantitative results.
1. What SDS-PAGE and Protein Quantification Show
|
QC Result |
What It Shows |
What It Does Not Show |
|
SDS-PAGE |
Overall protein band pattern, signal distribution, and obvious smearing |
Protein identity or the biological cause of the pattern |
|
Protein quantification |
Amount of recovered protein available for downstream analysis |
Abundance of individual proteins or biological differences between groups |
2. Using QC Results to Interpret Downstream Data
SDS-PAGE patterns and recovered protein amounts can be interpreted alongside identification coverage and quantitative profiles. An atypical band pattern accompanied by reduced identification coverage may point to sample-related factors affecting protein recovery, as discussed in Sample-Related Challenges in Fecal Proteomics.
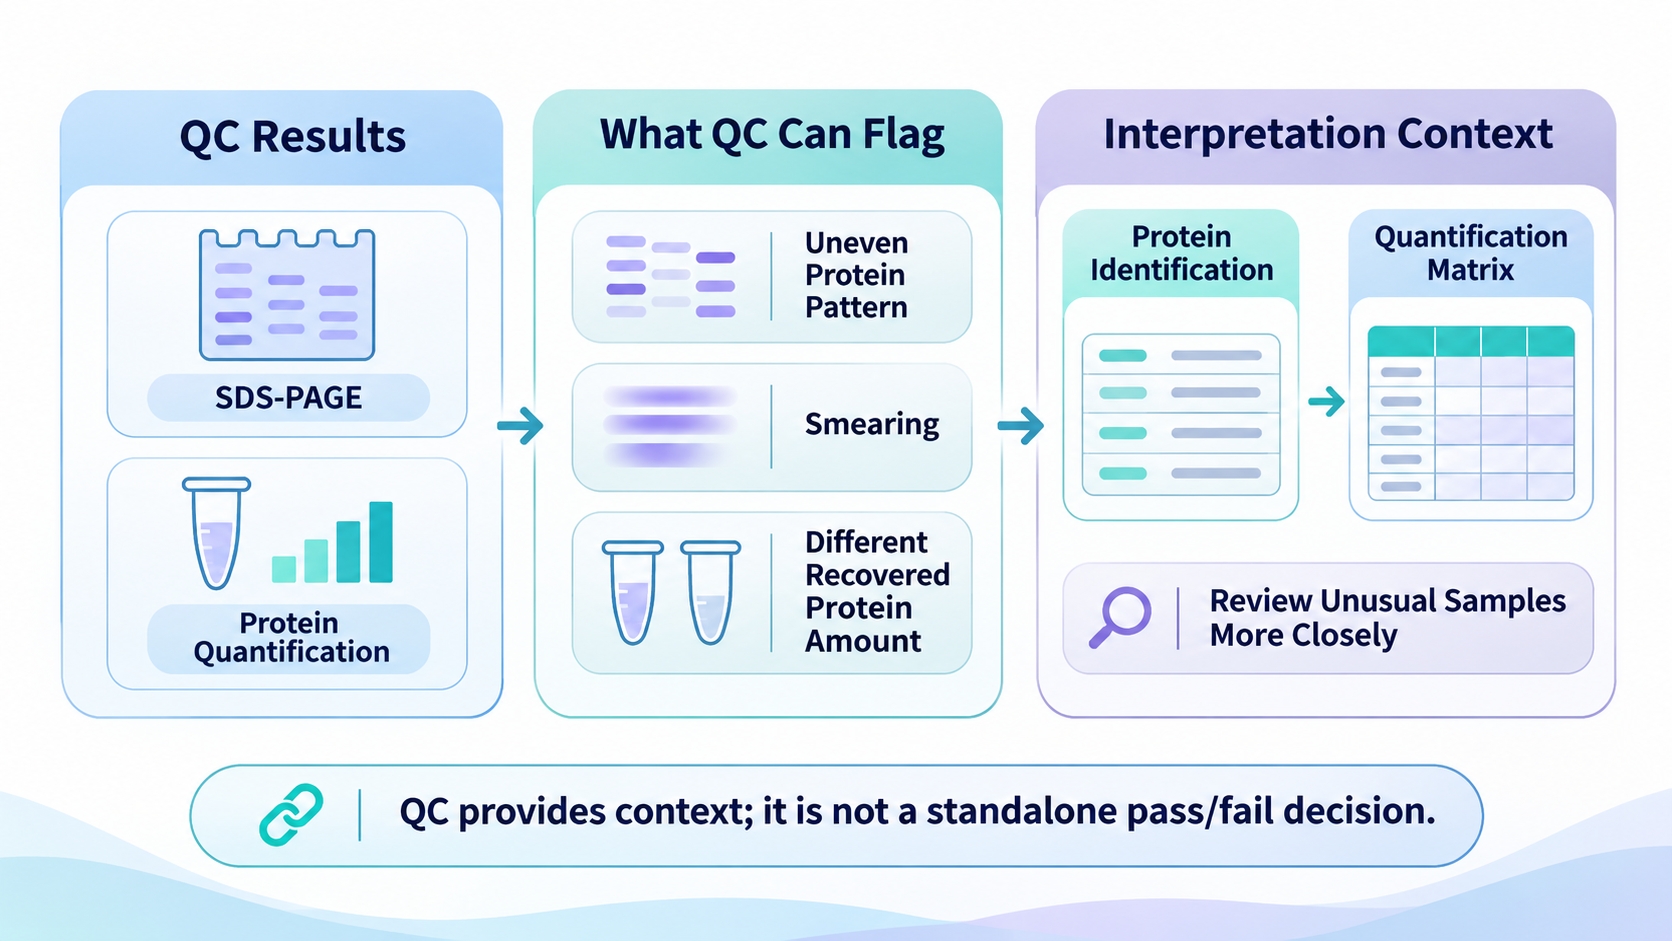
Figure 2. Using QC results to interpret downstream fecal proteomics data.
Protein Identification Results
Protein identification matches LC-MS/MS peptide evidence to entries or protein groups in a selected reference database. The result reflects the detected peptides, database content, and protein-inference rules used in the search. The identification list reports the proteins supported by the applied search conditions; abundance patterns are evaluated in the quantitative results.
1. Identification Evidence and Coverage
The reported list depends on peptide evidence, reference-database content, and protein-inference rules. Proteins supported by shared peptides may be reported as protein groups, reflecting the resolution of the available peptide evidence. The list therefore describes the proteins identified under the selected database and search settings.
2. Interpreting Protein Counts
- Compare identification counts across datasets with matched reference databases and search settings.
- Record whether the output reports individual proteins or protein groups, since grouping rules determine how identification entries are counted.
- Interpret identification counts alongside coverage of proteins relevant to the study objective and the downstream quantitative results.
Protein Quantification Across Samples
The quantitative matrix records the signal assigned to each identified protein or protein group in each sample. The matrix supports sample-level pattern review and helps determine which proteins have sufficient quantitative coverage for a defined comparison. Interpretation begins with the reported metric and the processing applied before the matrix was generated.
1. Identify the Quantification Metric
The quantitative matrix may contain raw intensity, normalized intensity, a relative ratio, or a transformed value. Raw and normalized intensities represent signals on different processing scales, ratios depend on a reference, and transformed values follow a specified mathematical scale; the report's field definitions and processing notes identify the metric used.
Normalization adjusts sample-level signals to improve cross-sample comparability. Log-transformed values are interpreted on the transformed scale, while ratios depend on their reference denominator; the normalization method and transformation steps define how values should be compared across samples.
2. Evaluate Quantitative Coverage and Missingness
|
Matrix Checkpoint |
What to Examine |
Why It Matters |
|
Protein-level coverage |
Number of samples with a quantitative value for each protein. |
Shows how broadly each protein is represented in the comparison. |
|
Group-wise missingness |
Distribution of missing values across the study groups. |
Shows whether quantitative coverage is balanced across groups. |
|
Sample-level profile |
Quantified protein coverage and signal distribution within each sample. |
Highlights sample profiles for review alongside QC and metadata. |
|
Sample mapping |
Match between matrix columns, sample IDs, and group labels. |
Aligns each quantitative profile with the correct sample and group. |
A blank entry indicates that no quantitative value was reported for a protein–sample pair. The proportion and distribution of missing values across proteins, samples, and groups, considered alongside the documented filtering or imputation workflow, show how missingness may affect the comparison.
Quantitative coverage is evaluated at both protein and sample levels. A protein quantified in most samples provides broader evidence for a comparison than one represented by only a few values, while sample-level coverage and signal distribution, considered alongside QC and metadata, show how each sample contributes to the comparison.
3. Interpret Relative Abundance Within the Same Protein
Relative abundance compares the measured signal of the same protein across samples or groups. The matrix reports relative MS signal within the applied quantification workflow; because digestion, ionization, and MS response vary among proteins, abundance patterns are interpreted within the same protein across the stated samples or groups.
Differential Protein Analysis
Differential analysis evaluates relative abundance changes within a defined comparison. Each result is linked to the groups and reference order specified in the contrast. Interpretation combines the comparison, change direction and magnitude, and the statistical evidence reported for that contrast.
1. Read the Comparison and Direction
|
Result Element |
Interpretation |
|
Contrast |
Identifies the groups or conditions being compared and the reference order. |
|
Direction |
Shows which group has the higher relative abundance under that order. |
|
Magnitude |
Describes the size of the difference, often as a fold change. |
|
Statistical evidence |
Indicates the statistical support reported for the difference; interpret the metric according to its definition. |
For a Treatment-versus-Control contrast, the reported direction follows that order. A higher relative abundance in Treatment is described as increased in Treatment versus Control. Reversing the contrast reverses the direction of the same difference, so the comparison label determines how the result is read.
2. Interpret Effect Size and Statistical Support
Effect size describes the magnitude of a change, while a P-value or adjusted P-value summarizes statistical evidence. A large fold change may have limited support when sample variability is high; a smaller change may be supported when sample patterns are consistent. Effect size, statistical evidence, sample-level patterns, and the study objective together provide a basis for prioritizing biologically relevant changes.
3. Prioritize Differential Proteins
Proteins with a clear quantitative pattern, statistical support, and relevance to the research question are strong candidates for follow-up investigation. Consistency across samples and contribution to study-related functional patterns help prioritize the candidates; group and replicate planning is discussed in Experimental Design for Fecal Proteomics Studies.
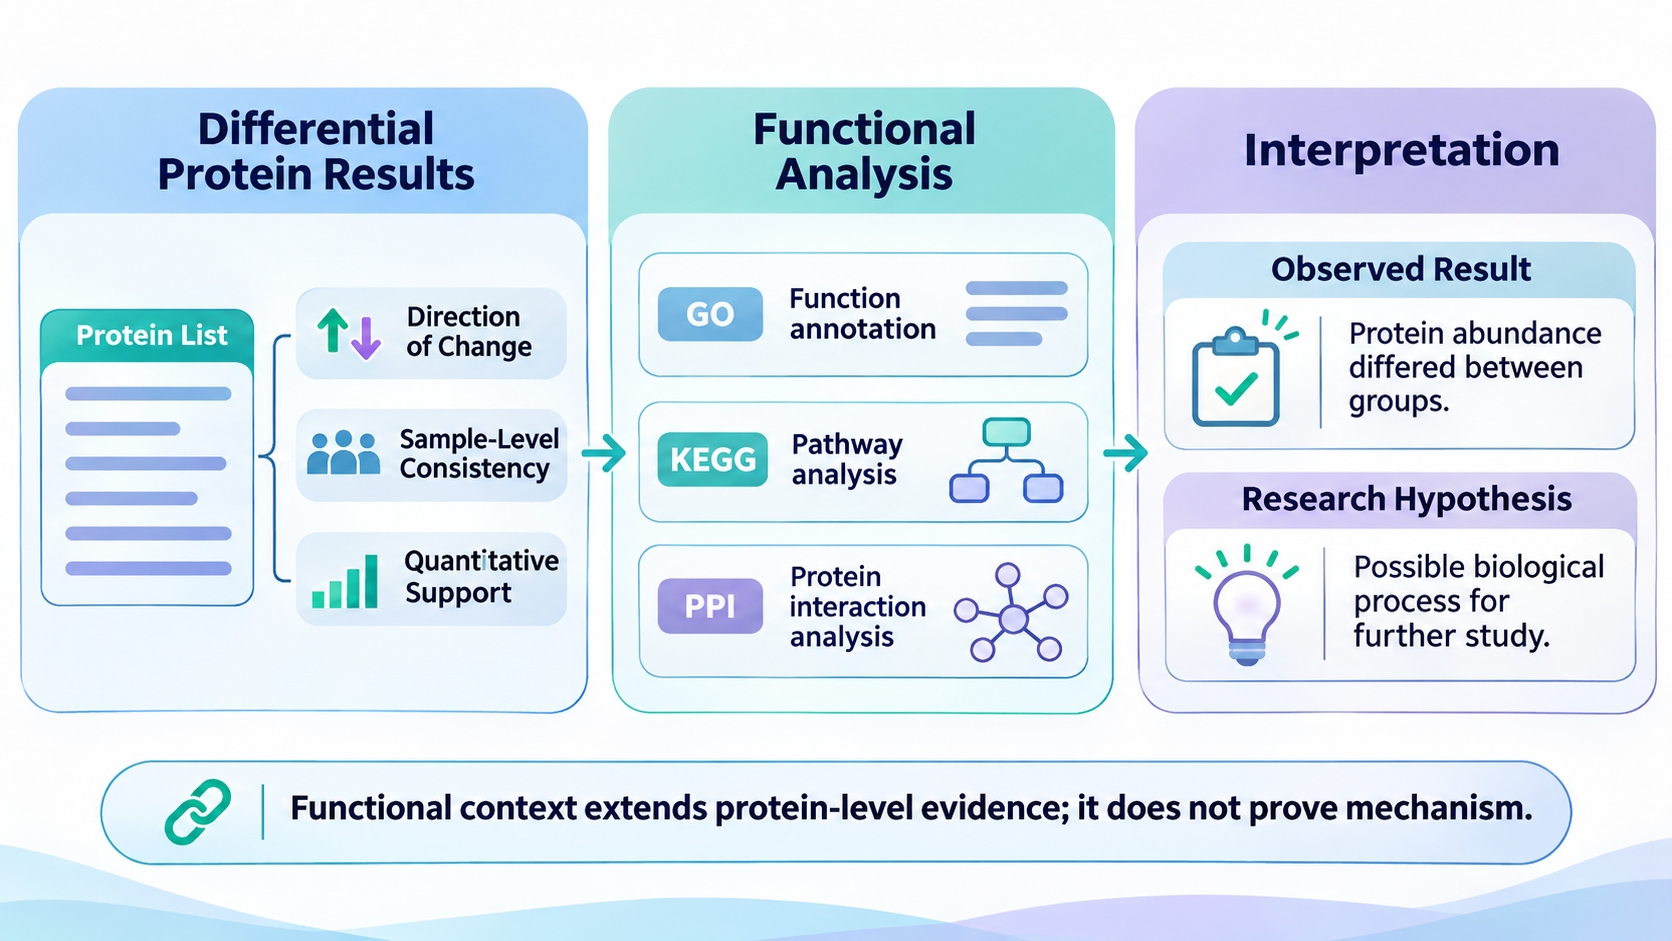
Figure 3. Connecting differential protein results with functional analysis and research interpretation.
GO, KEGG, and PPI Functional Analysis
Functional analysis adds annotation, pathway, and interaction context to selected proteins. The input protein set, such as differential proteins, determines which functional patterns are represented in the analysis, while the proteins contributing to each result connect the annotation with the original dataset.
1. GO Functional Analysis
Gene Ontology (GO) organizes annotations into Biological Process (BP), Molecular Function (MF), and Cellular Component (CC). Enrichment identifies terms overrepresented in the selected protein set relative to a reference background; the contributing proteins and overlap among related terms show which functional patterns are represented by the dataset.
2. KEGG Pathway Analysis
KEGG maps proteins to curated pathway frameworks. The differential proteins contributing to each enriched pathway, their abundance directions, and the number of proteins supporting the pathway-level pattern link pathway annotations to the protein-level results.
3. PPI Network Analysis
PPI analysis organizes selected proteins by known or predicted interaction relationships. Network connections highlight proteins with shared interaction context based on information in the reference resource, and network membership considered alongside identification and differential evidence helps prioritize proteins for further investigation.
Relate the Findings to the Research Question
The final interpretation connects the primary research question with protein-level findings and functional context. A clear account starts with the main comparison or biological process, then brings together the quantitative results that address the question and the GO, KEGG, and PPI findings that add functional context.
1. Distinguish Observations, Associations, and Hypotheses
|
Evidence Level |
What the Results Show |
How to Use the Finding |
|
Protein observation |
A relative abundance difference in a defined comparison. |
Review sample-level consistency and relevance to the research question. |
|
Functional association |
GO or KEGG annotations, or PPI relationships represented by selected proteins. |
Examine contributing proteins and connect the annotation with quantitative findings. |
|
Research hypothesis |
A biological interpretation suggested by combined protein and functional patterns. |
Define a follow-up question for further investigation. |
A clear conclusion moves from measured protein abundance changes to the associated functional patterns, then to a biological interpretation framed as a research hypothesis for further investigation.
Frequently Asked Questions
1. Does a small number of differential proteins indicate poor data quality?
Differential-protein counts are influenced by quantitative coverage, biological variation, the contrast being tested, effect sizes, and statistical criteria. The count is most informative when considered alongside QC results, sample-level quantitative patterns, and the study design.
2. Why can the same dataset produce different differential protein lists across comparisons?
Each contrast represents a distinct biological comparison. Differences in group composition, abundance patterns, sample variability, and reference order lead to different protein lists and change directions.
3. Can GO or KEGG enrichment results be compared directly between independent studies?
Cross-study comparison is most informative when the input protein sets, reference backgrounds, annotation resources, database versions, and statistical procedures are aligned. Analysis settings and contributing proteins considered together help explain differences between studies.
4. Does a highly connected PPI protein necessarily act as a key regulator?
High connectivity identifies a network hub within the selected interaction resource. The protein's differential evidence, functional context, and supporting literature provide additional grounds for prioritizing a candidate for regulatory follow-up.
5. What does it mean when no GO or KEGG terms meet the enrichment criteria?
The enrichment analysis reports no GO or KEGG terms meeting the selected statistical criteria. Input-set size, annotation coverage, and reference-background selection help explain the result.
Conclusion
Fecal proteomics results are best read as a connected sequence of evidence. QC provides the initial quality context, protein identification defines what was detected, quantitative data show how protein signals vary across samples, and differential analysis identifies group-associated changes. GO, KEGG, and PPI then provide functional and interaction context for those proteins.
The final interpretation should return to the original research question and distinguish measured protein changes from functional associations and research hypotheses. For a broader overview, see Fecal Proteomics: Sample Preparation, Analysis, and Applications. Researchers with defined data-analysis, report-interpretation, or follow-up validation needs can use Fecal Proteomics Solutions to discuss the appropriate next step with MtoZ Biolabs.
