


Protein–protein interaction (PPI) mapping is the construction of a graph: proteins as nodes, reported contacts as edges, and a stated evidence type on each edge. The map is a framework for seeing neighborhood structure, not a more accurate substitute for the assay that produced those edges. Proteins contribute to structural maintenance, signal transduction, immune responses, and metabolism, usually as assemblies rather than as isolated chains. Mapping is therefore used to place a protein in a system, to flag hubs under a stated condition, and to nominate disease-associated neighborhoods. Yeast two-hybrid (Y2H), co-immunoprecipitation (Co-IP), enrichment mass spectrometry, and bioinformatics prediction can all add edges. They do not add the same kind of edge.
A map can support later function hypotheses and target nomination when experimental, predicted, and database layers are kept separate. Bioinformatics has made large graphs easier to draw. It has not made those graphs highly accurate by default. Mixing a Y2H screen, an AP-MS table, and a STRING score into one unlabelled network is the usual source of over-read hubs and false disease links. Diagnostic or treatment-development claims sit outside ordinary research mapping unless a separately validated assay framework is in place.
Researchers who already have a defined bait, candidate neighborhood, or project objective can also review the MtoZ Biolabs Protein-Protein Interaction Analysis Service for project-specific feasibility and analysis planning.
What a PPI Map Is Allowed to Show
A well-built map can display which proteins were recovered together, which binary pairs were reported in a screen, and which predicted or curated edges sit near that experimental core. It can help rank nodes for follow-up under a physiological or pathological contrast. It cannot, by itself, assign a new molecular function, prove that a hub is a therapeutic target, or report dynamic occupancy unless the underlying experiment was designed for that readout.
Function prediction from neighborhood is a hypothesis. System-level language is appropriate only for the evidence that was actually collected. Disease-associated subgraphs can nominate targets; they do not identify treatments.
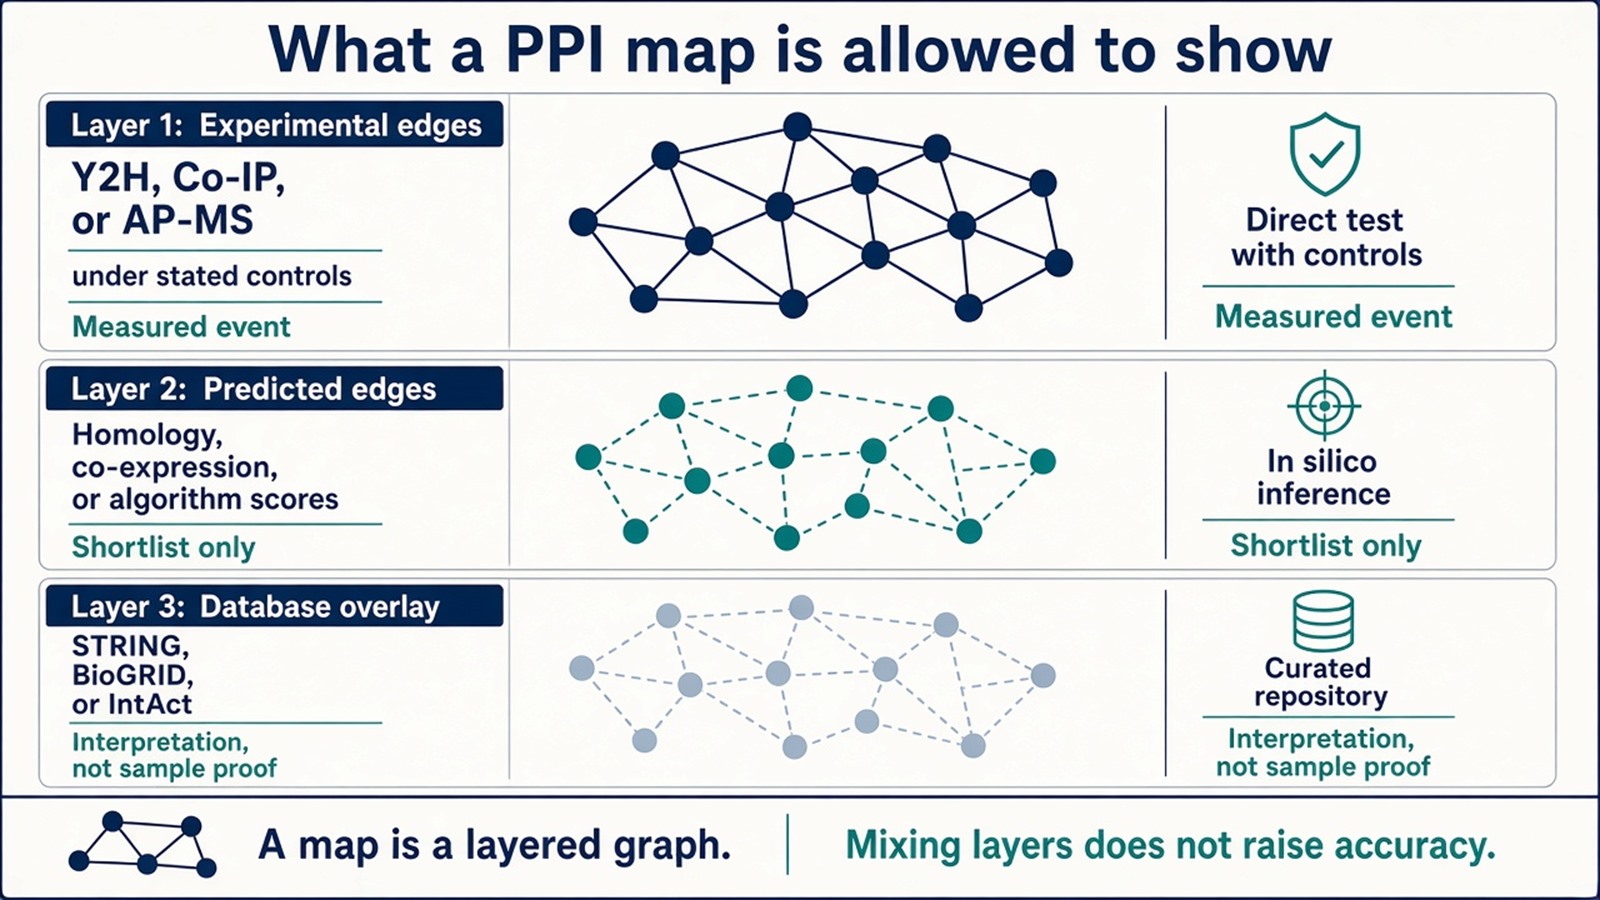
Figure 1. A PPI map is a layered graph: experimental edges, predicted shortlists, and database overlays. Combining layers does not raise the accuracy of any single edge.
Draw the map with evidence labels. An unlabeled edge cannot support the next biological sentence.
Methods for Protein–Protein Interaction Mapping
Map construction uses methods with different strengths and different false-positive structures. The common starting set is the following four.
1. Yeast two-hybrid system
Y2H detects binary interactions in yeast by reconstituting a transcription factor and restoring reporter expression. Throughput is high and the assay is relatively straightforward to scale, which is why it remains a common source of first-pass binary maps.
The limitation is not that Y2H is an in vitro binding assay. It is an in-yeast nuclear reporter. False-positive rates can be high, membrane proteins are often a poor fit, and contacts that need mammalian modifications may be missed. A Y2H edge belongs on the map as a genetic binary hypothesis until Co-IP or another cellular assay is closed.
2. Co-immunoprecipitation
Co-IP is widely used to test whether a nominated pair or a small complex survives antibody enrichment. It is a validation layer on a map, not a genome-wide drawing tool. Specificity follows antibody quality, isotype or bead-only controls, and wash stringency. Multi-protein complexes need a written design; Co-IP does not automatically resolve subunit order.
3. Mass spectrometry
Mass spectrometry becomes a mapping method when it is coupled to enrichment, most often Co-IP-MS or affinity purification–mass spectrometry (AP-MS). The useful product is an identified partner inventory for a bait, not a precise molecular-weight list of “interacting proteins.” Sensitivity and protein coverage are high relative to a single Western. Interpretation still requires matched controls and a scoring rule. An enrichment table is a bait-centered neighborhood, not a complete interactome. For evidence-type detail, How to Identify Protein–Protein Interactions Using Mass Spectrometry provides a more detailed explanation of AP-MS limits.
4. Bioinformatics prediction
Prediction uses databases, homology, co-expression, docking, or trained models to propose edges that have not been measured in the current sample. The route is fast and low in wet-lab cost. Output quality follows the training set and the database mix. A predicted edge is a shortlist item. It should be drawn on a separate layer from Y2H or AP-MS. For how measurement and prediction should be looped rather than ranked, Experimental vs Computational Methods for Protein Interaction Detection provides a more detailed comparison of allowed claims.
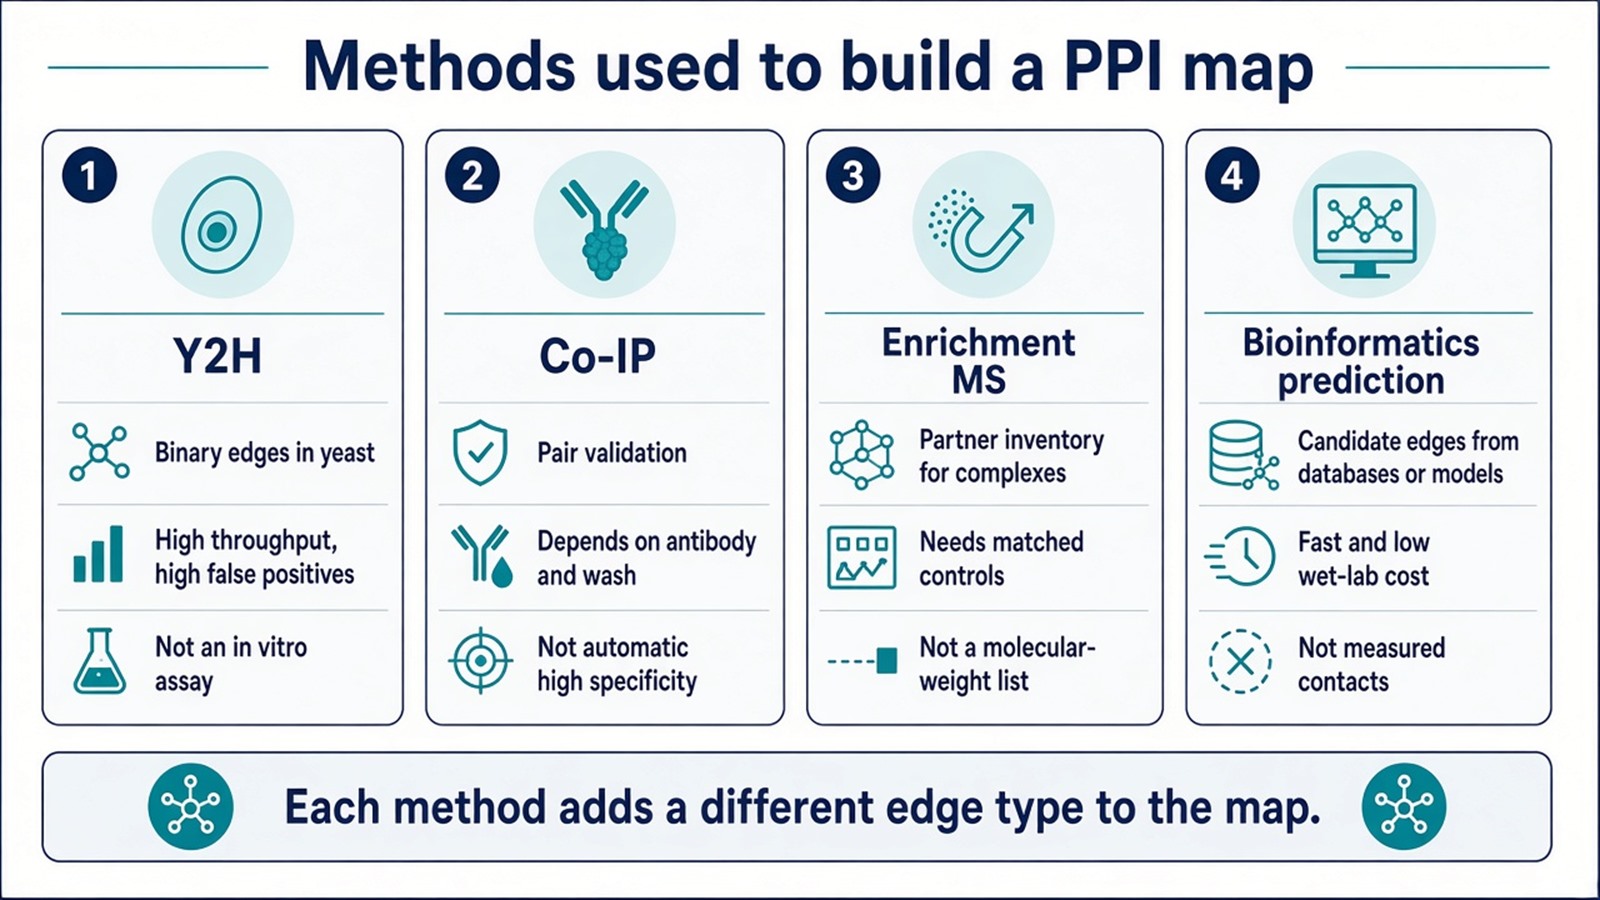
Figure 2. Mapping methods add different edge types: binary yeast pairs, antibody-validated contacts, control-filtered MS neighborhoods, and computational shortlists.
Key Considerations and Benefits
1. Precision in experimental design
A reliable map starts from a stated model system, a defined bait or pair set, and a validation plan for the edges that will be interpreted. Choosing an experimental host that cannot produce the contact, or skipping controls because a later database will “confirm” the edge, weakens the graph before visualization begins.
2. Integration of techniques and analytics
Integration is useful when each method keeps its own layer. Y2H or AP-MS can draft the experimental core; Co-IP can close selected pairs; prediction and curated databases can suggest the next experiment. Data-analysis tools extract clusters and scores from large tables. They do not create a comprehensive view by merging unlabeled evidence.
3. Applications in life sciences
PPI maps are used in basic network description, disease-mechanism studies, and early drug-target nomination. Those applications justify building the graph. They do not, by themselves, constitute progress in treatment development. For claim-first method selection when the project is not primarily a mapping exercise, How to Analyze Protein–Protein Interactions provides a more detailed explanation of analysis claims and method fit.
Database Resources for Protein–Protein Interaction Mapping
Public databases help annotate and compare a map. They do not validate the sample that was just analyzed.
1. STRING
STRING (often listed as StringDB) compiles known and predicted PPIs across many organisms. Channels include experimental records, text mining, and co-expression. Those channels must stay visible. A high combined score that is driven by text mining or co-expression is not equivalent to an experimental edge in the current lysate.
2. BioGRID
BioGRID stores protein, genetic, and chemical interaction records from multiple species. Many datasets are manually curated from literature. A BioGRID edge reports that a published experiment supported the contact. It does not report that the same contact was recovered in the present AP-MS or Y2H set.
3. IntAct
IntAct is an open molecular-interaction archive with standardized records for protein–protein, protein–DNA, and protein–RNA contacts, curated from contributing projects. It is a useful annotation layer for mixed interaction types. Standardization improves comparability. It does not convert a database record into sample-level proof.
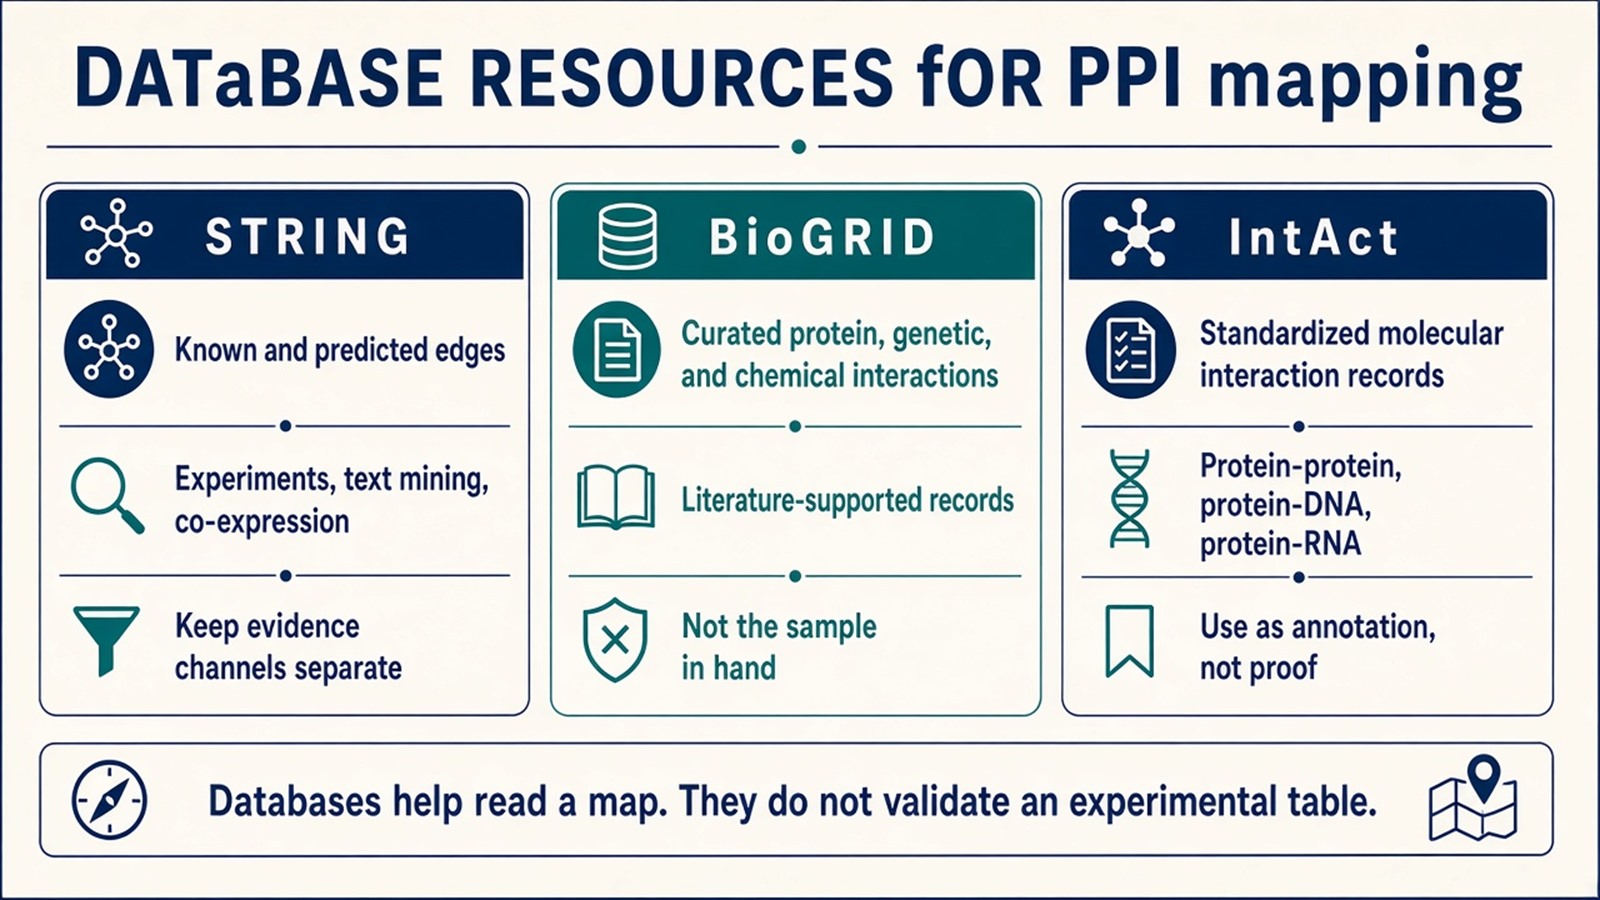
Figure 3. STRING, BioGRID, and IntAct help read and compare a map; none of them validates an experimental table from the samples in hand.
Database degree is not independent evidence that a recovered protein binds the bait.
Experimental Limits and Design Boundaries
Y2H maps nuclear reconstitution in yeast. Co-IP maps wash-stable antibody enrichment. Enrichment–MS maps a control-filtered neighborhood. Prediction maps plausibility. STRING, BioGRID, and IntAct map prior knowledge and inference. Drawing them as one color does not produce a highly accurate interactome. Hub status on a mixed graph is especially easy to over-read.
Project Planning and Service Scope
A usable mapping plan names the edge type that will be drawn first, the host system, the controls, and which public databases will be used only as overlays. MtoZ Biolabs scopes affinity-tag strategies, including FLAG, HA, Strep, and GFP, across common cell systems, Orbitrap-class LC-MS/MS detection for AP-MS or Co-IP-MS neighborhoods, and network annotation after the experimental table is closed. Recovery of low-abundance or membrane nodes still depends on capture chemistry and filtering, not on the visualization software.
Once the edge type, method family, and overlay rule are defined, the project can be scoped as a PPI mapping study. Researchers can review the MtoZ Biolabs Protein-Protein Interaction Analysis Service for project-specific sample evaluation, feasibility assessment, and workflow planning.
Frequently Asked Questions
1. Is a PPI map the same as a measured interaction list?
No. A map is a graph that may mix experimental edges, predicted edges, and database overlays. Only the experimental layer reports events in the current study.
2. Can STRING, BioGRID, or IntAct validate an AP-MS or Y2H table?
No. Those resources annotate and prioritize. Sample-level evidence remains the enrichment or screen against its own controls.
3. Does mass spectrometry mapping mean reporting molecular weights of partners?
No. Mapping uses enrichment–MS to identify proteins that co-purify with a bait. Molecular weight alone does not assign an interaction.
4. Should bioinformatics prediction start or finish a map?
Either, if the layer is labeled. Prediction can propose a shortlist or suggest missing edges after an experimental core exists. It should not be merged unmarked into the measured graph.
5. Does a hub on the map automatically become a drug target?
No. Hub status can rank proteins for follow-up. Target nomination still needs a defined contact, a matched assay, and later orthogonal work.
Reference
- Szklarczyk D., Gable A.L., Lyon D., et al. (2019). STRING v11: protein-protein association networks with increased coverage, supporting functional discovery in genome-wide experimental datasets. Nucleic Acids Res., 47, D607-D613. https://doi.org/10.1093/nar/gky1131
- Oughtred R., Rust J., Chang C., et al. (2021). The BioGRID database: a comprehensive biomedical resource of curated protein, genetic, and chemical interactions. Protein Sci., 30, 187-200. https://doi.org/10.1002/pro.3978
- Orchard S., Ammari M., Aranda B., et al. (2014). The MIntAct project—IntAct as a common curation platform for 11 molecular interaction databases. Nucleic Acids Res., 42, D358-D363. https://doi.org/10.1093/nar/gkt1115
- Fields S., Song O. (1989). A novel genetic system to detect protein-protein interactions. Nature, 340, 245-246. https://doi.org/10.1038/340245a0
- Gingras A.C., Gstaiger M., Raught B., Aebersold R. (2007). Analysis of protein complexes using mass spectrometry. Nat. Rev. Mol. Cell Biol., 8, 645-654. https://doi.org/10.1038/nrm2208
- Berggard T., Linse S., James P. (2007). Methods for the detection and analysis of protein-protein interactions. Proteomics, 7, 2833-2842. https://doi.org/10.1002/pmic.200700131
