



CUT&Tag can map genomic regions associated with transcription factors and histone modifications, but interpreting the resulting peaks requires more than identifying enriched regions. Antibody performance, experimental controls, and signal patterns all affect whether the data support a reliable picture of chromatin occupancy and how differences between conditions should be interpreted. This guide covers the key decisions involved in CUT&Tag study design, from target and control selection to sequencing quality checks and peak interpretation.
Researchers considering this method can use the MtoZ Biolabs CUT&Tag Analysis Service to discuss target, antibody, sample context, comparison design, and data outputs. For a broader overview of interaction research, see Protein Interaction Analysis: What It Reveals, Key Methods, and Applications.
Principle of CUT&Tag for Chromatin-Associated Targets
CUT&Tag uses an antibody to recognize a chromatin-associated target in permeabilized cells or nuclei. A secondary antibody may be used to strengthen recruitment. A fusion protein containing protein A or protein G and Tn5 transposase then binds near the target antibody. Upon activation, Tn5 cuts nearby DNA and inserts sequencing adapters. The resulting fragments are amplified, sequenced, aligned, and analyzed to identify enriched genomic regions (Kaya-Okur et al., 2019).
By directing transposase activity to antibody-bound sites, CUT&Tag concentrates library formation near the selected chromatin feature. Compared with workflows that fragment chromatin before immunoprecipitation, CUT&Tag can provide favorable signal-to-background characteristics and use input material efficiently. Actual performance depends on sample quality, target accessibility, antibody performance, and transposase activity.
The biological interpretation depends on the target. Transcription-factor CUT&Tag identifies genomic regions associated with a selected factor, whereas histone-mark CUT&Tag maps the distribution of a specific chromatin modification. Histone marks may form narrow peaks or broad genomic domains, depending on the modification and biological context.
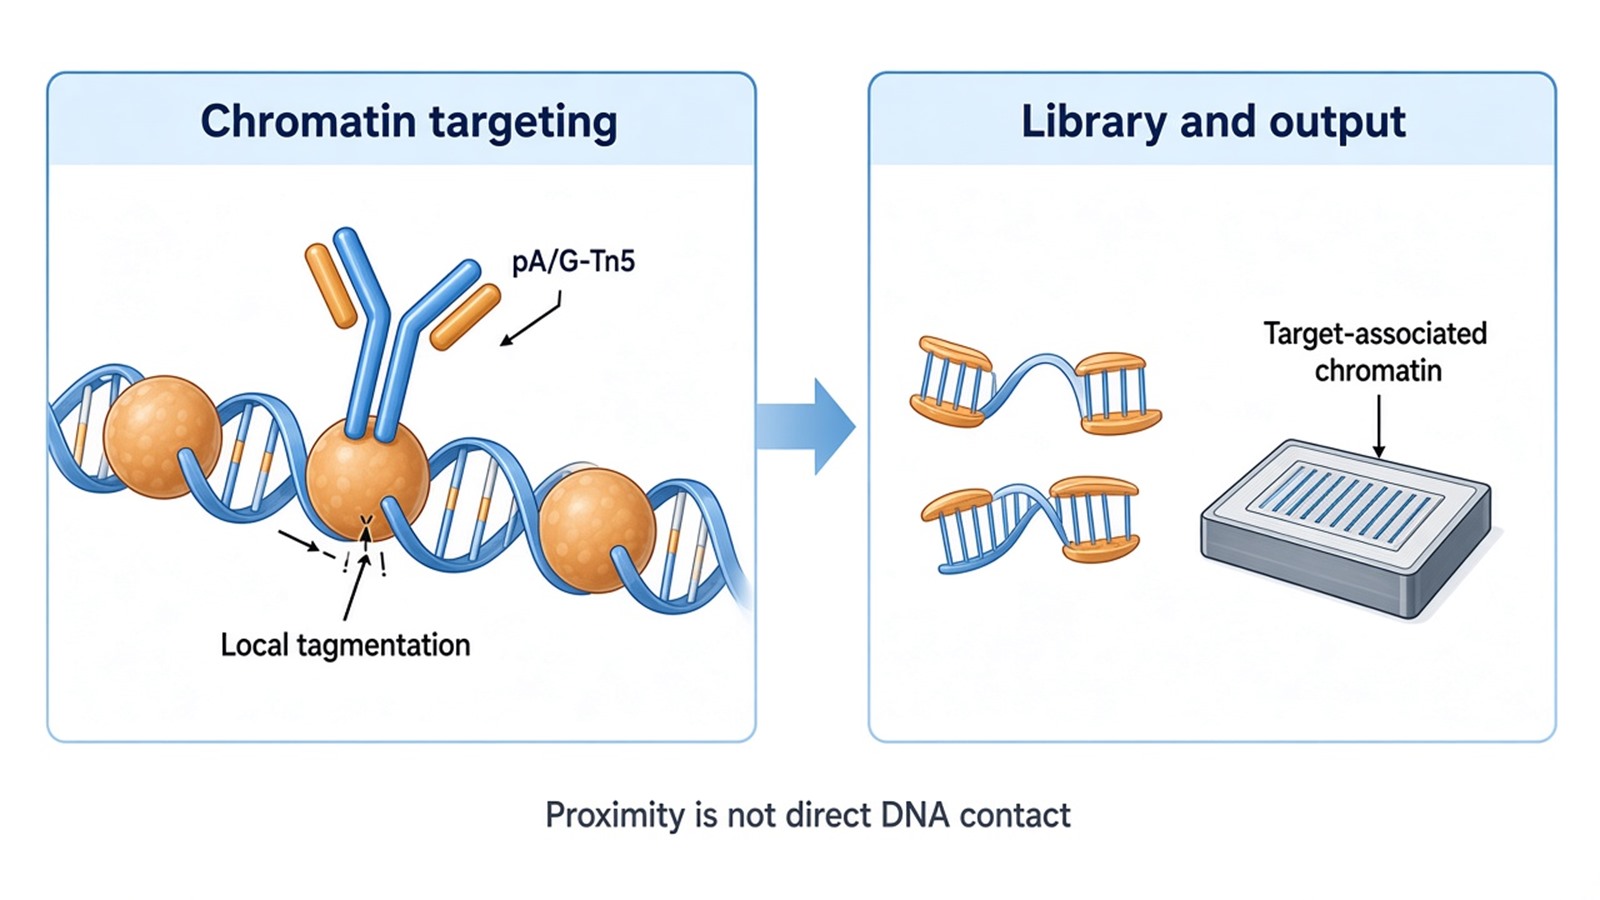
Figure 1. Antibody-guided Tn5 tagmentation creates sequencing-ready fragments near a chromatin target, producing an occupancy or chromatin-feature readout rather than proof of direct DNA contact.
Choosing Targets, Controls, and Comparisons for CUT&Tag
Target Selection and Antibody Suitability
Start by defining the biological comparison and expected signal pattern. Common study designs include treatment versus vehicle, mutant versus wild type, different developmental states, or comparisons of a histone mark across tissues. The objective may be to map target occupancy, compare chromatin features, or prioritize genomic regions for further investigation.
Antibody suitability is central to the design. The antibody should recognize the intended target in the relevant species and sample context. Previous immunoblotting or immunofluorescence results can provide supporting information, but performance in those assays does not guarantee specificity or enrichment in CUT&Tag. Antibody validation should therefore consider the intended target, biological material, and assay.
Controls and Biological Replicates
Controls help distinguish target-associated enrichment from nonspecific background.
- IgG control: Estimates background associated with nonspecific antibody binding and transposase recruitment.
- Positive chromatin control: Helps assess whether sample preparation and the core assay are functioning as expected.
- Target-specific controls: Knockout, depletion, or epitope-tag controls can provide additional evidence of target specificity when available.
- Biological replicates: Independent biological samples help assess reproducibility and condition-associated variation.
Control selection should reflect the research question. For example, comparisons involving a treatment that changes target localization may require additional evidence that observed signal differences are not explained solely by redistribution of the target.
Biological replicates should represent independently collected or prepared biological units appropriate to the study. Technical repeats can assess measurement variability but do not replace independent biological samples. Experimental groups should be distributed across processing and library-preparation batches to reduce confounding.
Sample Context and Experimental Scope
Sample type, preservation, target abundance, and desired resolution influence the feasibility of a CUT&Tag project. Studies involving multiple histone marks require suitable antibodies and sufficient material for separate target-specific reactions. Integration with RNA sequencing or other assays also requires a defined biological comparison and compatible sample collection.
Bulk CUT&Tag and single-cell CUT&Tag are distinct experimental formats. Similarly, feasibility for fresh or frozen material does not automatically establish suitability for FFPE tissue or every other sample type. These details should be evaluated against the target and study objective before the experimental plan is finalized.
CUT&Tag Data Types and Quality Checks
Sequencing Quality and Mapping
The primary data consist of sequencing reads generated from DNA fragments tagged near the selected chromatin target. Initial quality checks typically include:
- Read quality and adapter content
- Mapping rate and duplicate rate
- Library complexity and fragment-size distribution
- The number and proportion of reads retained for downstream analysis
These metrics help identify technical problems and determine whether the data are suitable for further analysis.
Peak Calling and Signal Patterns
Aligned reads are used to generate genome-wide coverage profiles and identify enriched regions. Peak-calling methods and parameters should reflect the expected target pattern. Transcription factors often produce localized peaks, whereas histone modifications may generate narrow peaks, broad domains, or mixed patterns.
Background controls and genome characteristics should inform peak-calling decisions. Applying identical settings to every target without considering the expected signal pattern can distort the resulting enrichment map.
Replicate Concordance and Annotation
Reproducibility can be evaluated using signal correlation, consistency of enriched regions, and inspection of representative loci in a genome browser. Global correlation and peak overlap provide complementary information, so both quantitative summaries and locus-level review are useful.
Peak annotation can assign enriched regions to promoters, gene bodies, and distal genomic regions. Motif enrichment can identify overrepresented sequence patterns that may help prioritize candidate regulatory factors. These analyses provide genomic context for follow-up studies, while gene assignment and motif enrichment alone do not establish regulatory function.
Repetitive and poorly mappable regions require particular care because sequencing and alignment properties can affect the apparent enrichment pattern.
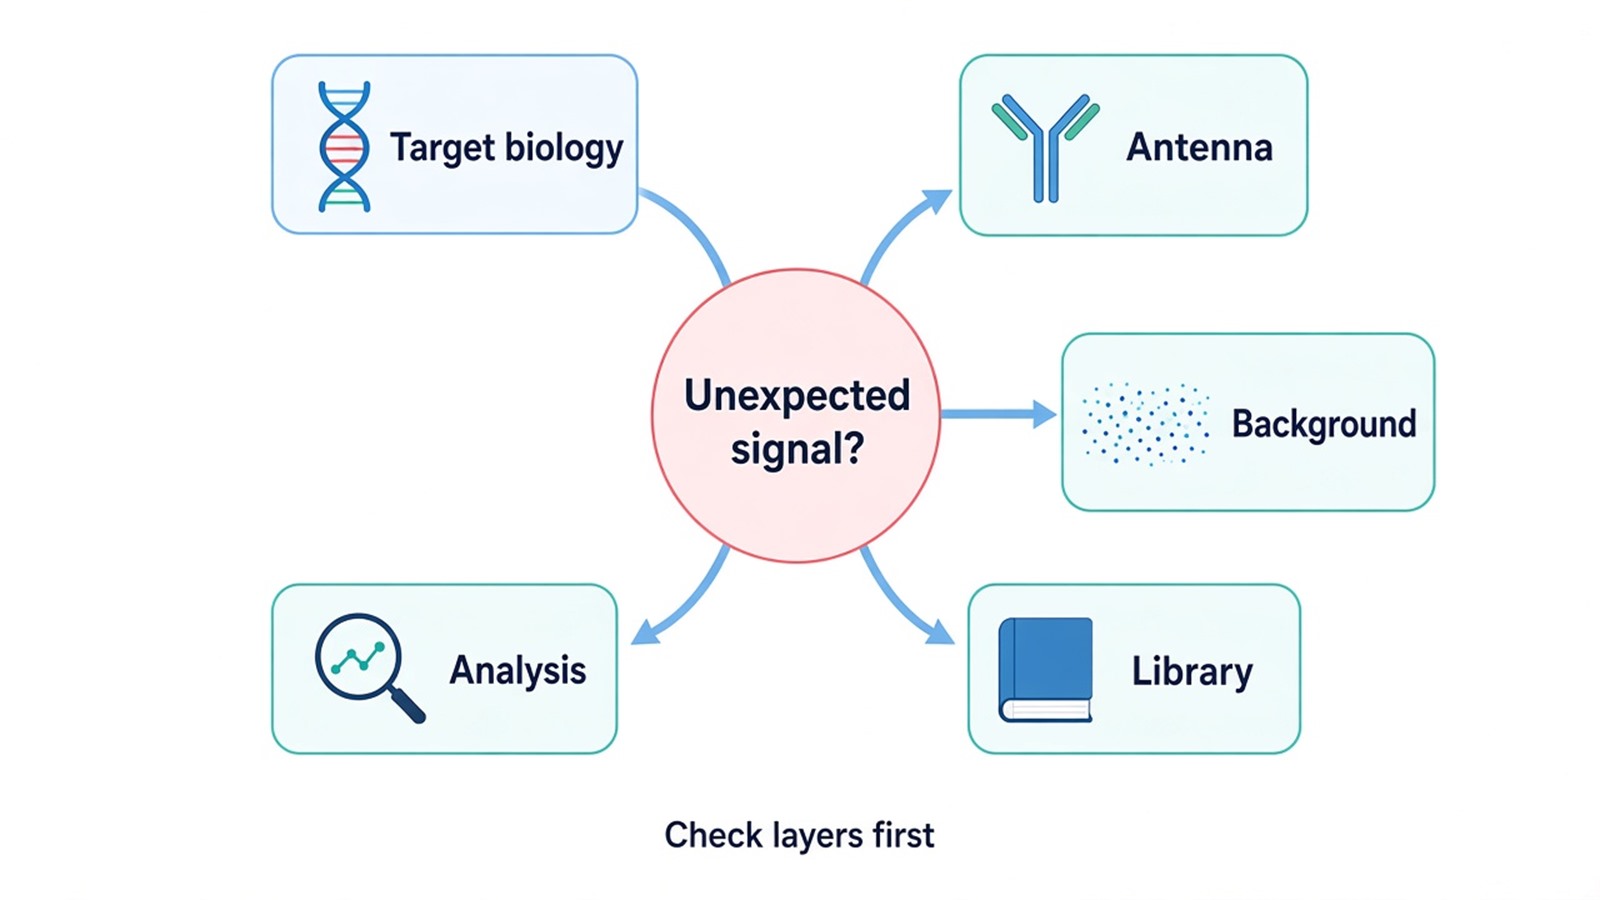
Figure 2. The decision map separates target biology, antibody specificity, background, library quality, mapping, and peak-analysis checks for an unexpected CUT&Tag result.
Interpreting Binding and Chromatin Signals
A reproducible CUT&Tag enrichment indicates that the selected protein or histone feature is associated with chromatin near the enriched region in the tested sample. For transcription factors, the result supports chromatin occupancy, which may involve direct DNA recognition or indirect recruitment through other proteins. For histone modifications, the signal describes the genomic distribution of a chromatin feature.
Comparing Conditions
Differences between conditions should be evaluated using normalized signal across a consistent set of genomic regions, with biological variation accounted for in the analysis. Peak counts alone can be misleading because sequencing depth, background, library complexity, and analysis thresholds affect the number of called peaks.
A region detected in one condition but not another may reflect a biological difference, a change in signal strength near the detection threshold, or technical variation. Quantitative comparison and replicate consistency help distinguish these possibilities.
Connecting Chromatin Signals to Gene Regulation
Assigning a peak to the nearest gene provides a useful starting point, but the nearest gene is not necessarily the regulated target. Distal regulatory elements may act on genes located farther away, and broad histone-mark domains may span multiple genomic features.
RNA sequencing can determine whether chromatin changes coincide with differences in gene expression. Perturbation experiments can then investigate whether the candidate factor or genomic region contributes to the observed biological response. These complementary approaches help connect chromatin occupancy with potential regulatory effects.
Interpreting Negative or Unexpected Results
Weak or absent enrichment can arise from low target abundance, transient occupancy, antibody limitations, unsuitable sample preservation, inaccessible epitopes, heterogeneous cell populations, or poor mappability. Review the positive control, target expression, library quality, and genomic context before drawing conclusions from a negative result.
For unexpected enrichment, first examine independent replicates, negative controls, and the stability of the signal under reasonable analysis settings. Targeted validation at representative loci and an orthogonal assay can help determine whether the observation is reproducible.
CUT&Tag vs ChIP-Seq for Study Planning
CUT&Tag and ChIP-Seq both begin with a known chromatin target and produce genome-wide enrichment maps, but their library construction and background sources differ. ChIP-Seq generally enriches target-associated chromatin after fragmentation and immunoprecipitation. CUT&Tag directs transposase activity near an antibody-bound target in situ. This distinction can affect material use, signal profile, fragment distribution, and how technical artifacts appear.
CUT&Tag may be attractive when material is limited or when in situ tagmentation gives a suitable signal-to-background profile for the selected target. ChIP-Seq may be preferable when a target, sample type, or established laboratory workflow already has strong validation in that method. Neither approach is universally superior. Antibody performance, target dynamics, sample matrix, comparison design, and expected signal shape can outweigh a general method preference.
For projects that require established ChIP-style controls or need to compare with a substantial legacy ChIP-Seq dataset, methodological continuity may improve interpretability. Researchers can review the ChIP-Sequencing (ChIP-Seq) Service when deciding how occupancy evidence, controls, and peak interpretation differ. Direct cross-platform comparison should account for method-specific biases rather than assume identical peak sets.
The DNA Pull-Down Assay Service addresses a different starting question. It uses a known DNA sequence to capture candidate proteins from an extract, while both CUT&Tag and ChIP-Seq start with a known protein or chromatin feature and map associated genomic regions. Selecting among these methods should begin with what is known, what remains unknown, and what evidence is required.
Frequently Asked Questions
1. Can several histone modifications be profiled from the same study?
Yes, if each target has a suitable antibody and the sample plan allocates enough material and controls for separate reactions. Signals from different marks should not be merged as if they measured the same chromatin property. Each mark needs target-aware quality review and biological interpretation.
2. What should be provided for a CUT&Tag feasibility discussion?
Provide the organism, sample type, target protein or histone mark, antibody information, sample preservation state, biological groups, independent sample availability, and desired conclusion. Known positive loci, previous antibody data, and plans for expression or functional follow-up can improve study planning.
3. Does a stronger CUT&Tag peak mean stronger gene activation?
No. Peak intensity reflects assay signal for target-associated chromatin and is influenced by occupancy, chromatin context, antibody behavior, library construction, and analysis. Gene activation is a separate claim that needs expression and functional evidence appropriate to the biological question.
Conclusion
CUT&Tag can generate informative maps of transcription-factor occupancy and histone-feature distribution when target selection, antibody suitability, biological controls, replication, and target-aware analysis are planned together. Its enriched regions should be interpreted as chromatin association evidence, with direct binding and functional regulation reserved for orthogonal testing. For project-specific assessment of target selection, sample suitability, controls, and analysis requirements, visit the CUT&Tag Analysis Service.
Reference
- H.S. Kaya-Okur, S.J. Wu, C.A. Codomo, E.S. Pledger, T.D. Bryson, J.G. Henikoff, K. Ahmad, S. Henikoff (2019). CUT&Tag for efficient epigenomic profiling of small samples and single cells. Nature Communications, 10, 1930. https://doi.org/10.1038/s41467-019-09982-5
- S. Henikoff, J.G. Henikoff, H.S. Kaya-Okur, K. Ahmad (2020). Efficient chromatin accessibility mapping in situ by nucleosome-tethered tagmentation. eLife, 9, e63274. https://doi.org/10.7554/eLife.63274
